


Almost perfect.
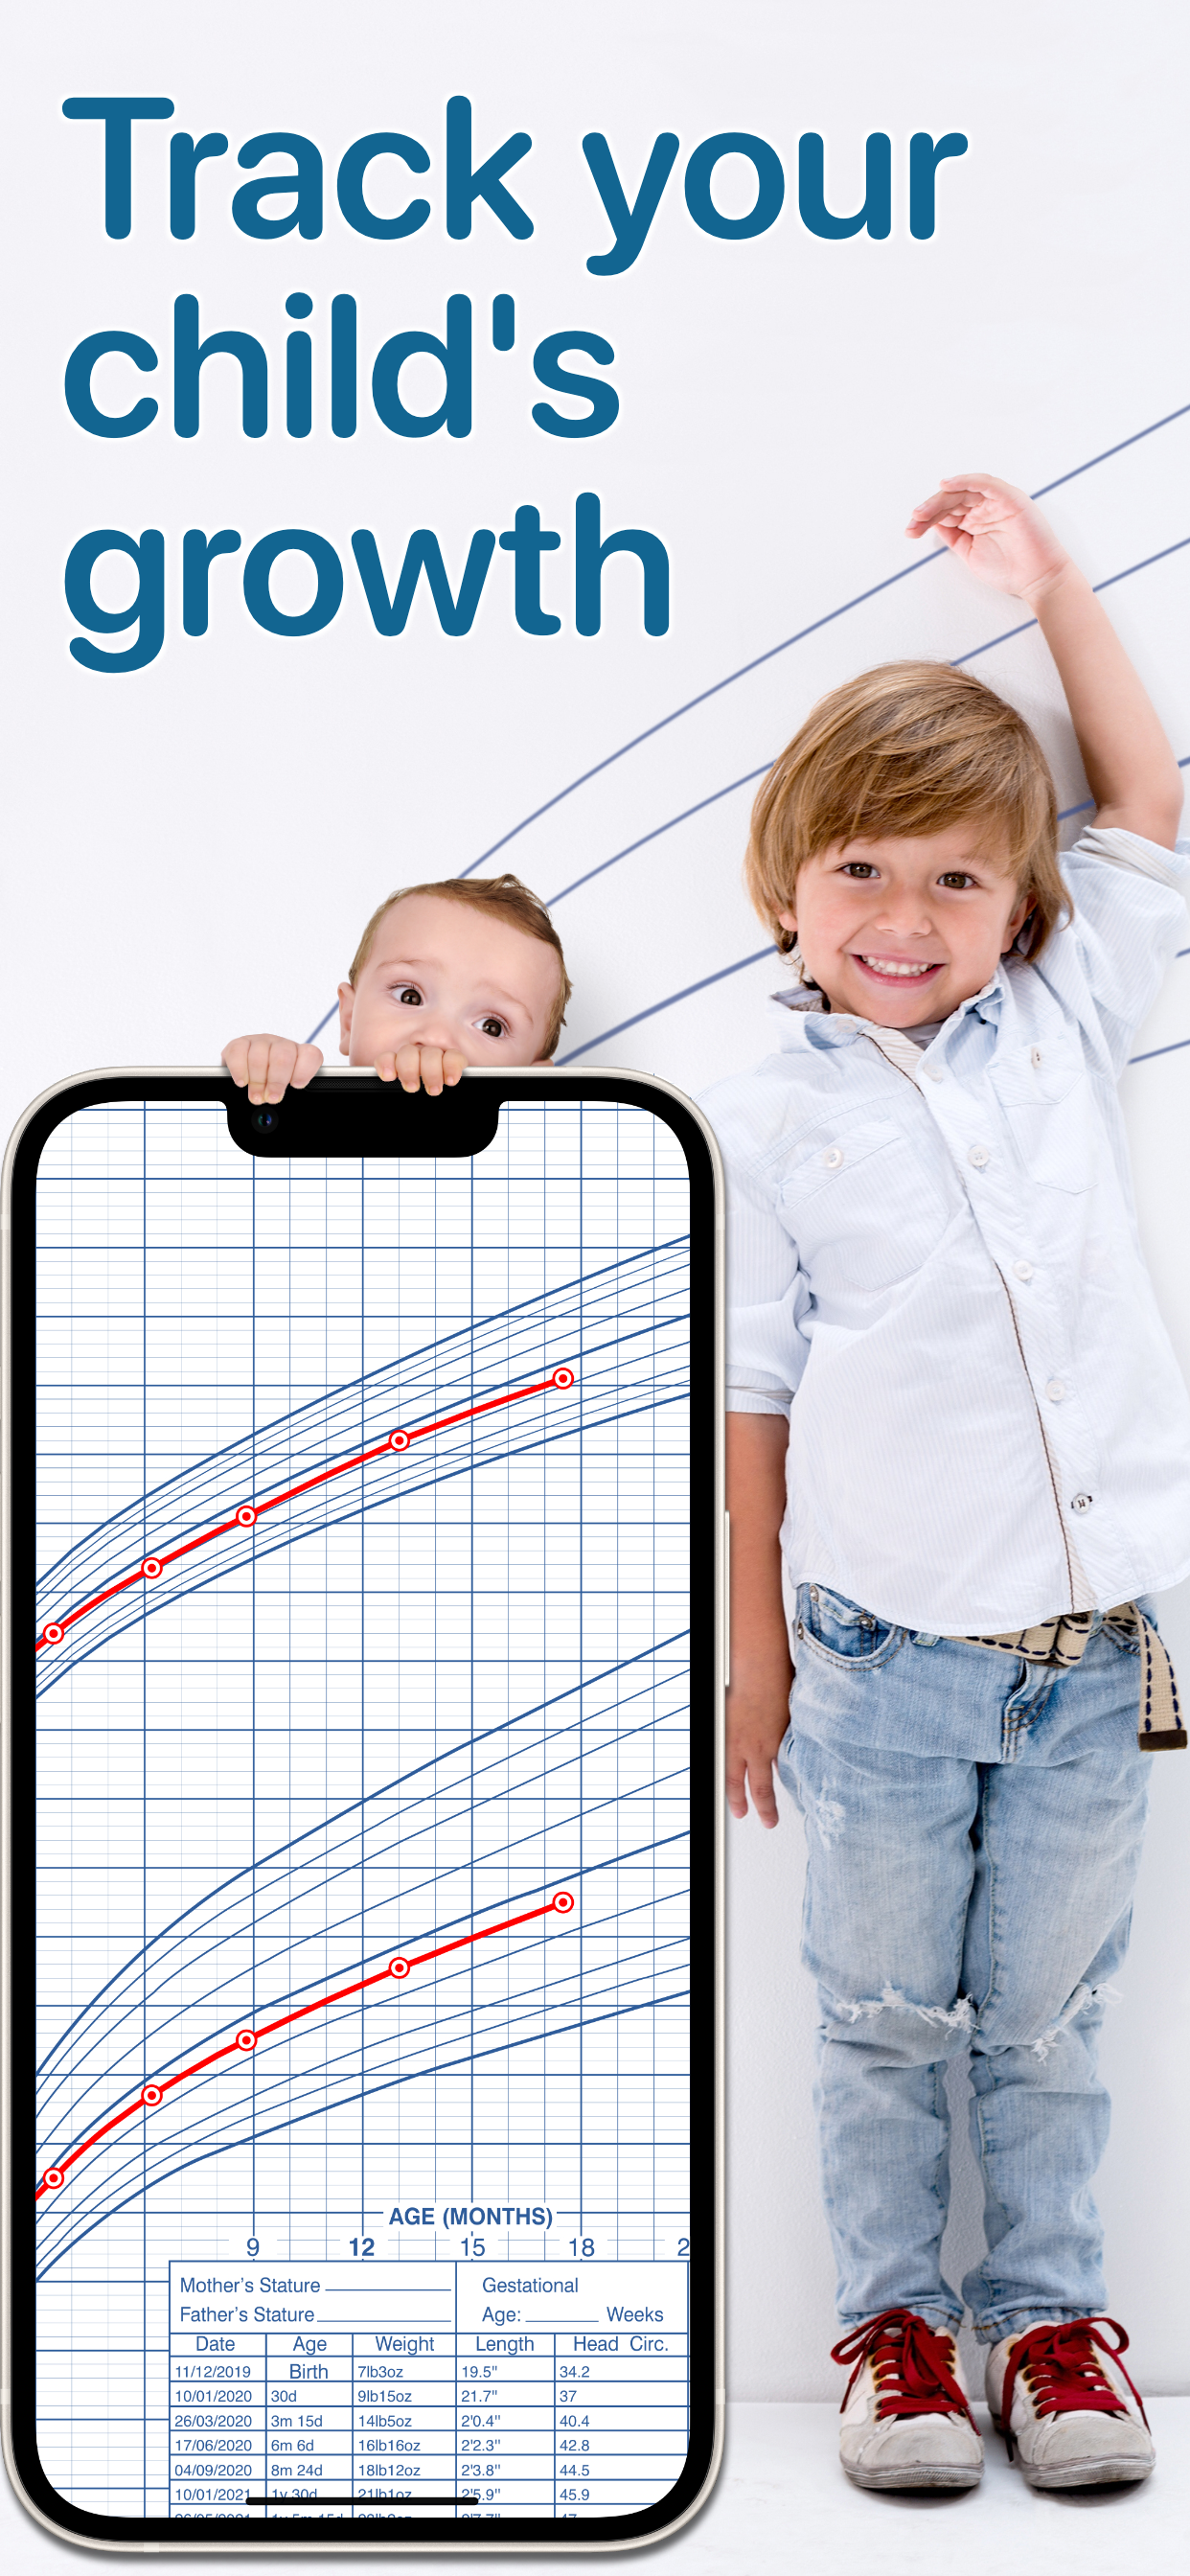
It would be helpful with a vertical line at the current date in the graphs. It would be great with localized growth charts as the normal growth varies by different regions of the world. The charts for e.g. Sweden are not the same as WHO or CDC.


