
Description
"Population simulator" is an application to visually see the changes in the population by using "Logistic Map".
You can see the change in the population by the Logistic Map by a line graph and colony size.
You can observe the variation pattern of population variety by changing slightly the initial value.
Logistic Map is not only used in Population Ecology but also considered one of the starting point of Chaos Theory. I developed this app to help people who are studying Population Ecology or Chaos Theory.
*Logistic Map may not necessarily apply to changes in population of actual organisms, because Logistic Map is a model of a simple change of the population.
■What is Logistic Map?
The Logistic Map is the map that is generated from the Logistic Function that has been devised as a variation model of the population of an organism.
It is expressed by the following function.
X(n+1) = a・X(n)・(1-X(n))
In the above equation, the meaning of each symbol is as follows.
・n:Generation (n=1,2,3,...)
・X(n):Value obtained by normalizing the Population of Generation n-th(0≦X(n)≦1)
・a:Value obtained by normalizing the Reproductive Rates(0≦a≦4)
You can calculate the population of the next generation from a population of a certain generation by using this function. In addition, You can predict the variation of the population over the long term by calculating the population of individuals repeatedly in this function.
■Pattern of Logistic Map
Logistic map vary widely depending on the value of "a".
・In case (0≦a≦1) : X(n) converges to 0.
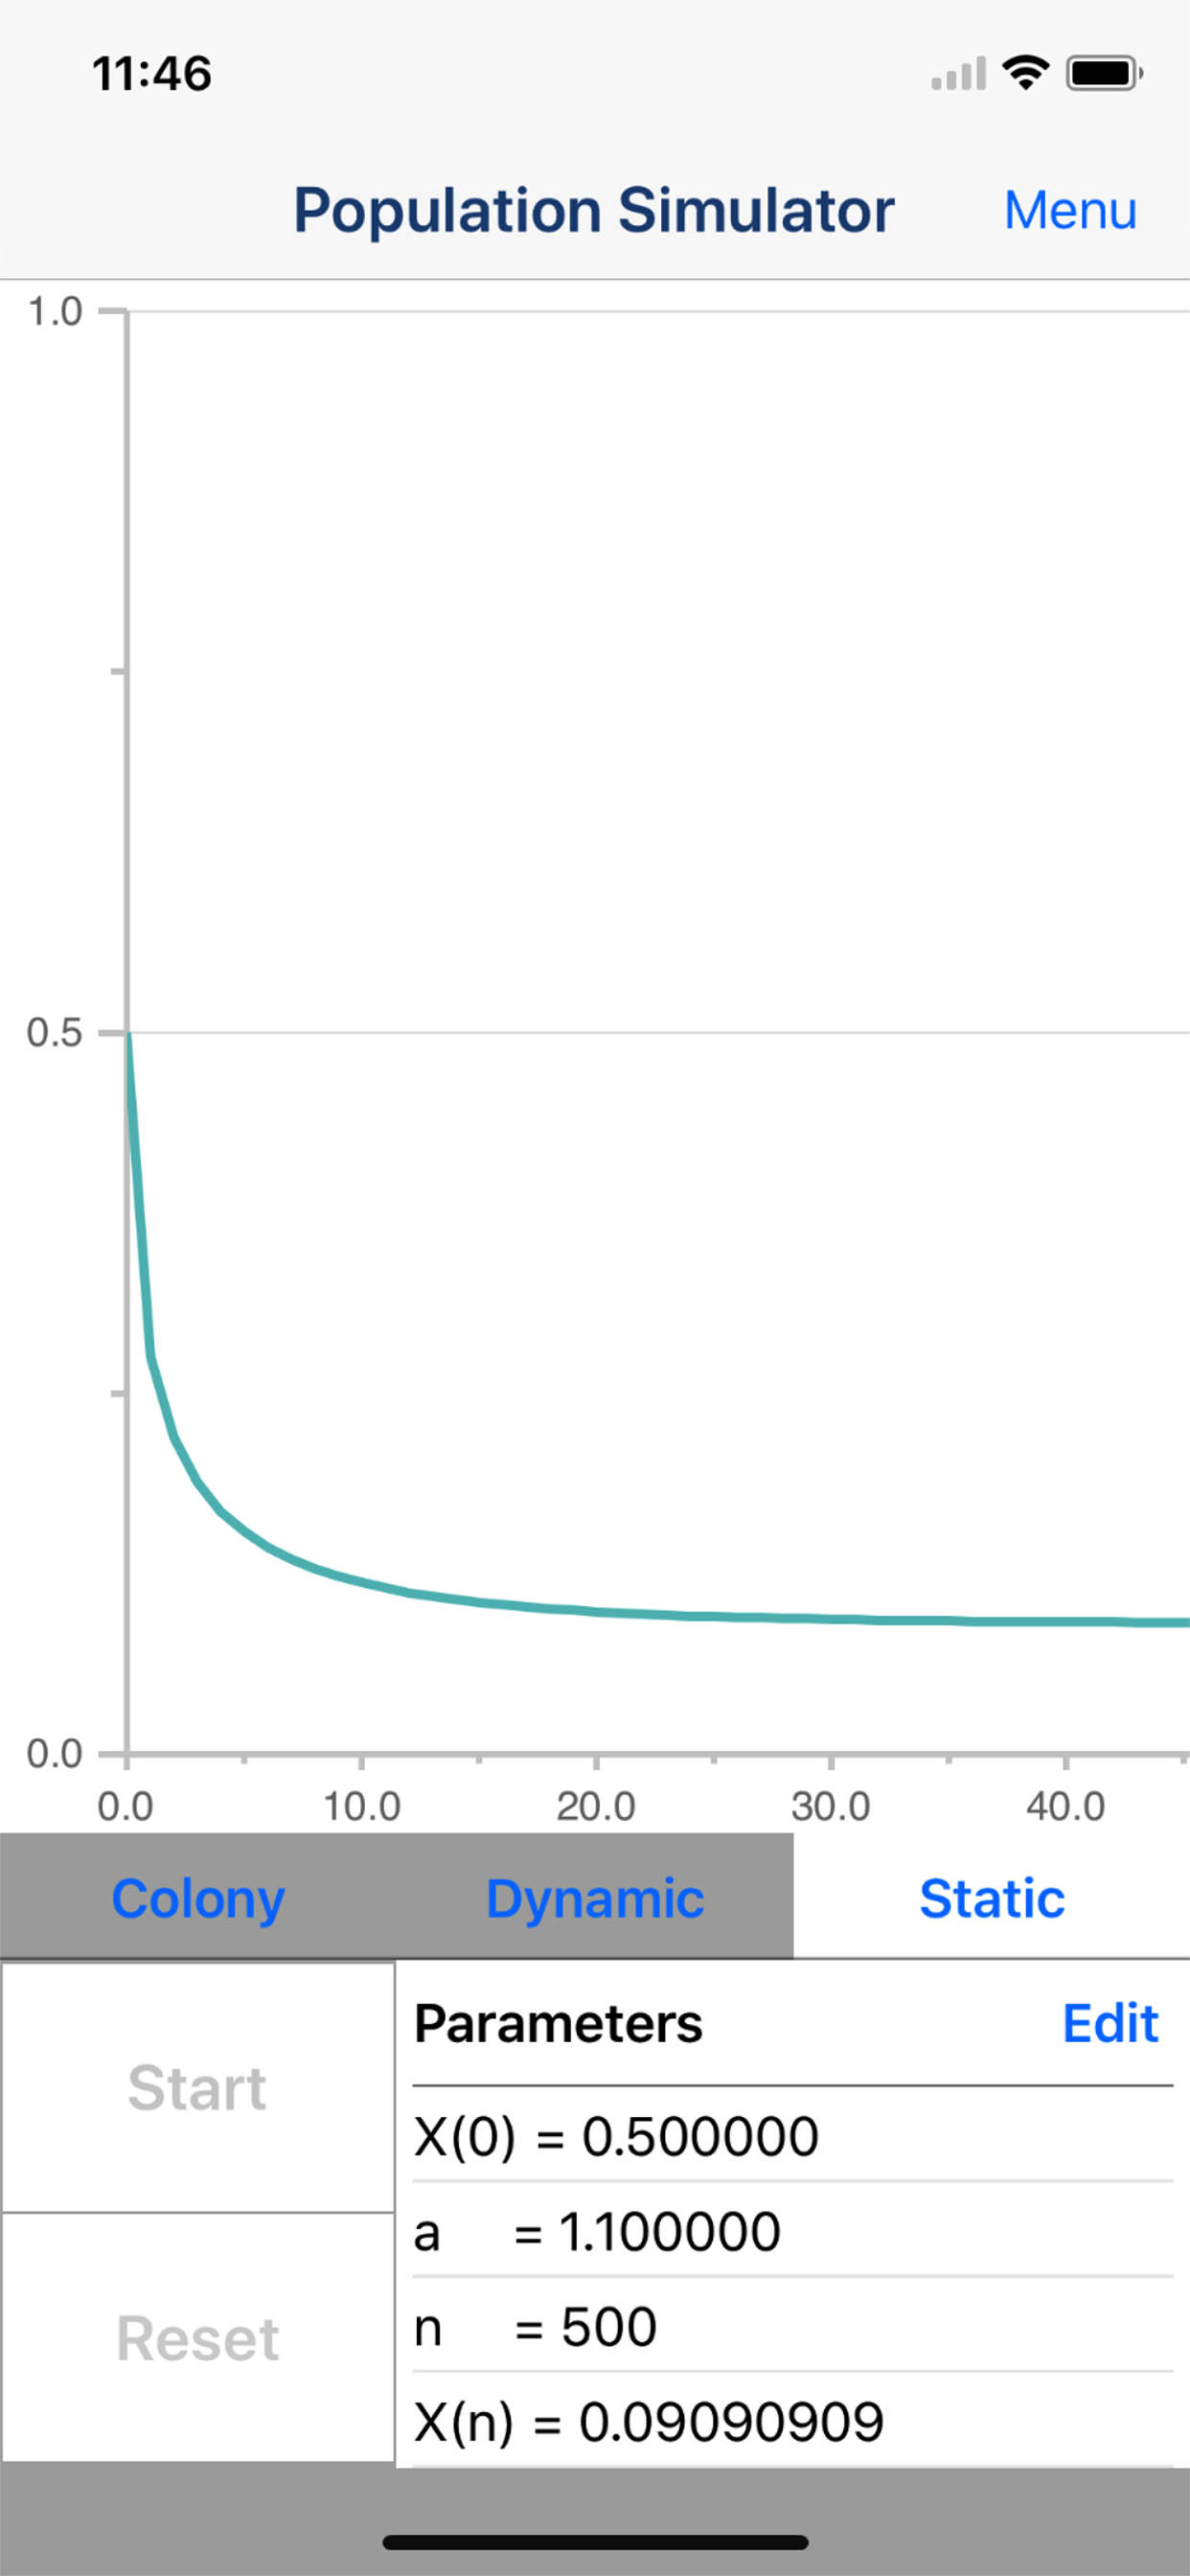
・In case (1<a≦2) : X(n) converges to 1-(1/a).
・In case (2<a≦3) : X(n) converges to 1-(1/a) while oscillating.
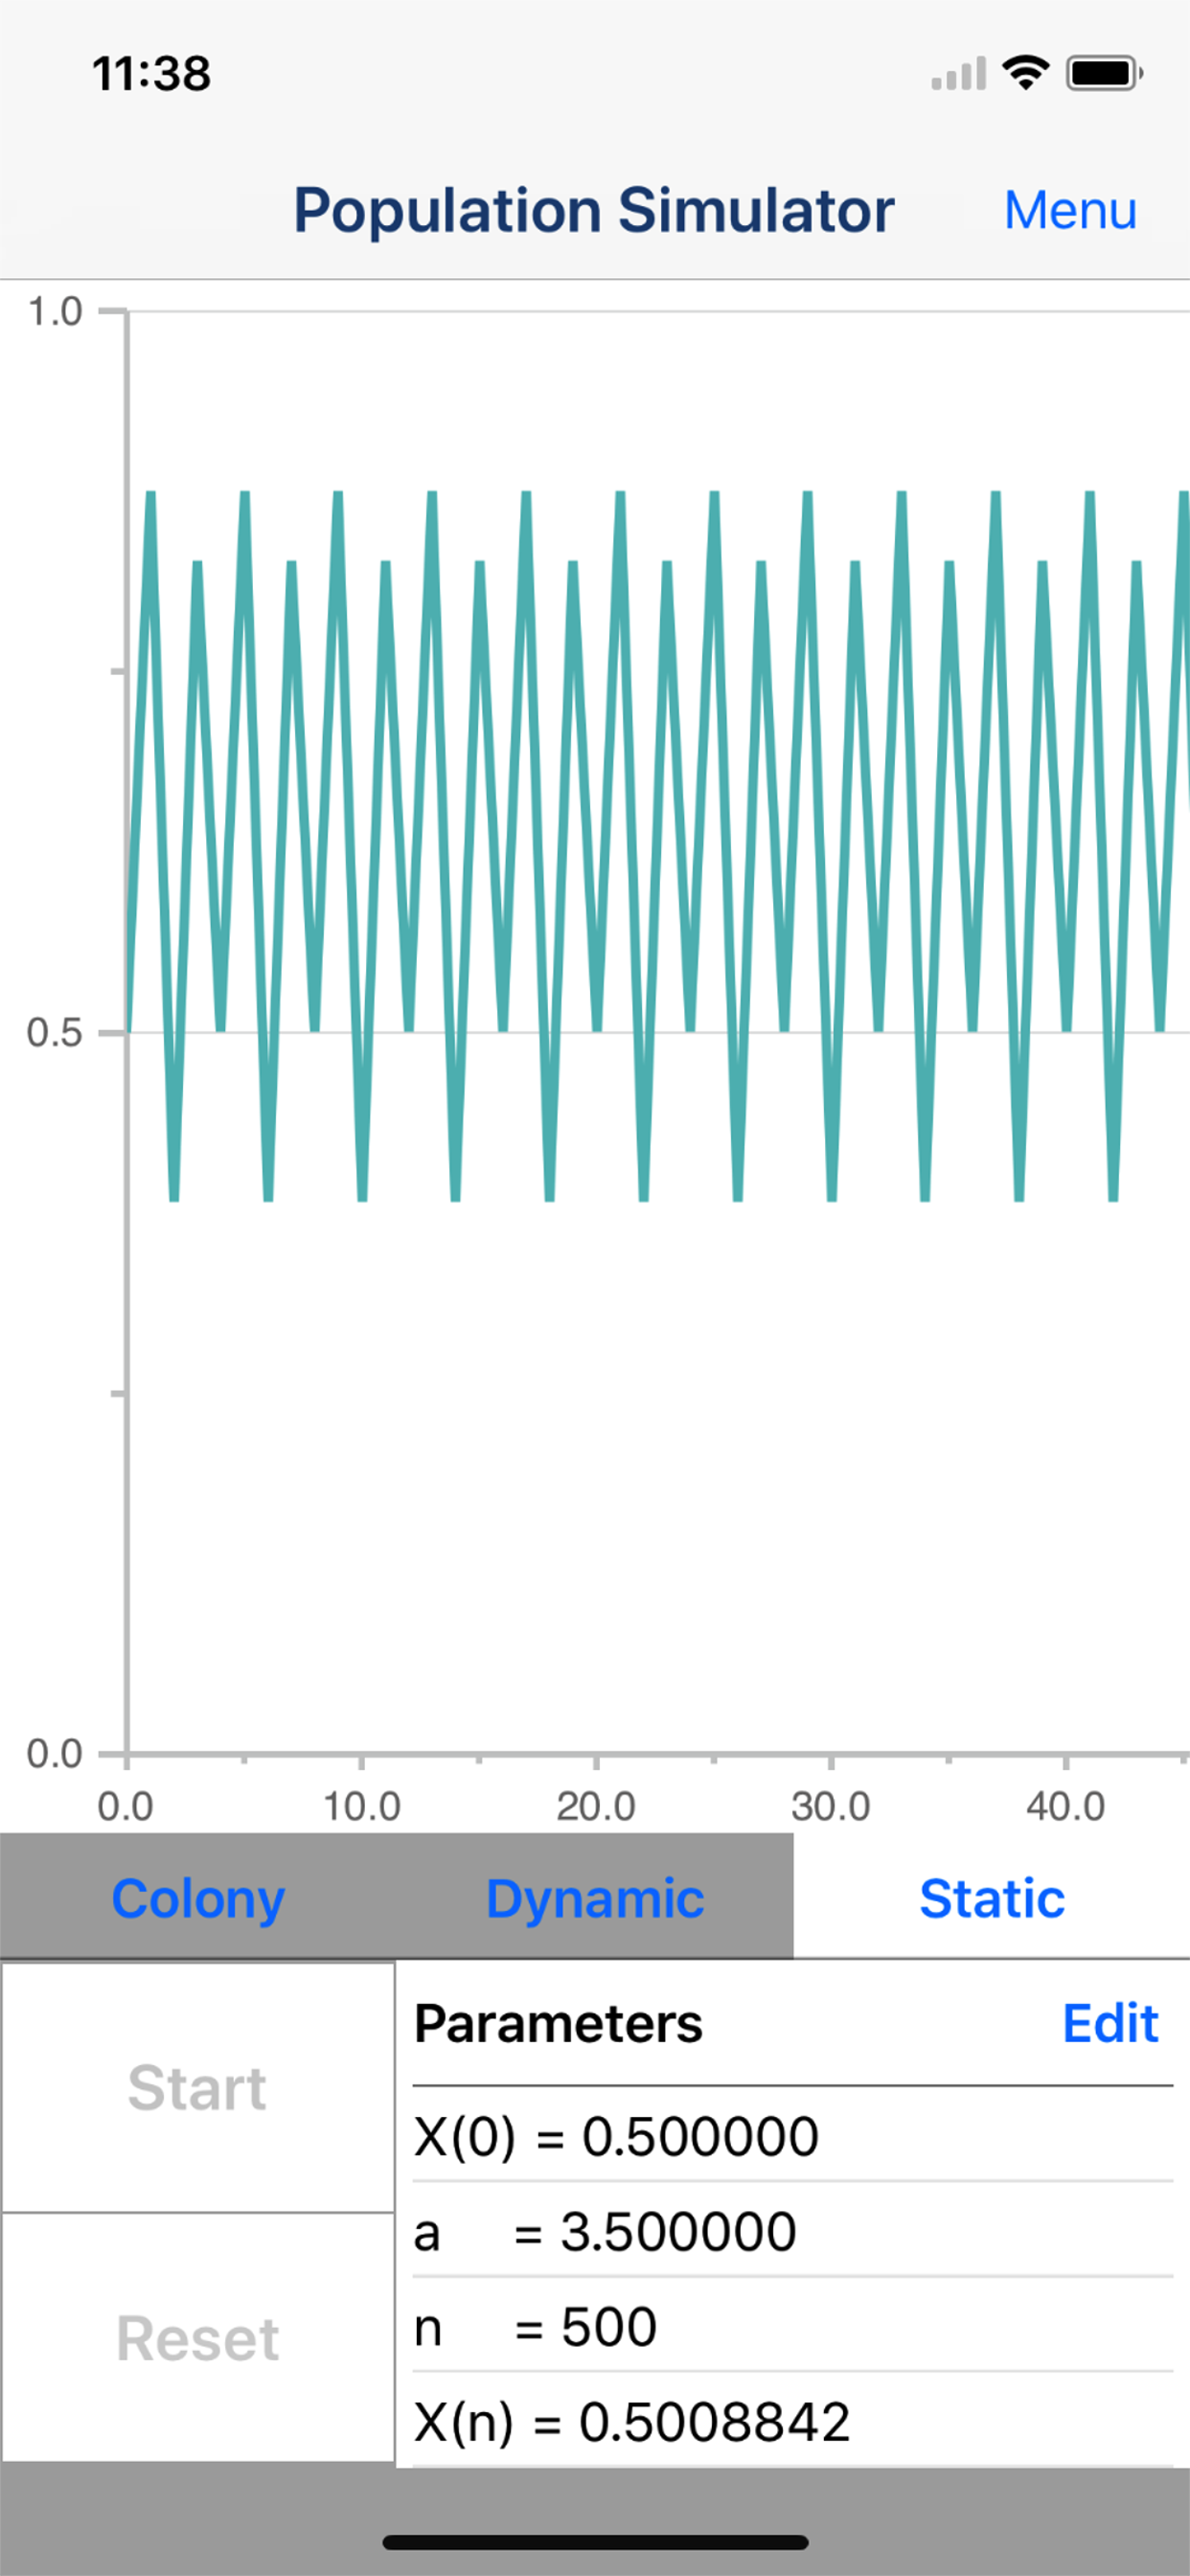
・In case (3<a≦3.5699456・・・) : X(n) oscillate between the periodic point individual Power of 2
・In case (3.5699456・・・<a≦4) : X(n) Change irregularly.(Chaotic region)*It may become periodically by the value of a.
Please try to observe the changes of Logistic Map by changing the various initial values.
■Main function of App
1. Simulation of changes in colony size
2. Line graph of changes in population
3. Output CSV file(Need to purchase add-on.)
4. Output Graph Image(Need to purchase add-on.)
Hide
Show More...
You can see the change in the population by the Logistic Map by a line graph and colony size.
You can observe the variation pattern of population variety by changing slightly the initial value.
Logistic Map is not only used in Population Ecology but also considered one of the starting point of Chaos Theory. I developed this app to help people who are studying Population Ecology or Chaos Theory.
*Logistic Map may not necessarily apply to changes in population of actual organisms, because Logistic Map is a model of a simple change of the population.
■What is Logistic Map?
The Logistic Map is the map that is generated from the Logistic Function that has been devised as a variation model of the population of an organism.
It is expressed by the following function.
X(n+1) = a・X(n)・(1-X(n))
In the above equation, the meaning of each symbol is as follows.
・n:Generation (n=1,2,3,...)
・X(n):Value obtained by normalizing the Population of Generation n-th(0≦X(n)≦1)
・a:Value obtained by normalizing the Reproductive Rates(0≦a≦4)
You can calculate the population of the next generation from a population of a certain generation by using this function. In addition, You can predict the variation of the population over the long term by calculating the population of individuals repeatedly in this function.
■Pattern of Logistic Map
Logistic map vary widely depending on the value of "a".
・In case (0≦a≦1) : X(n) converges to 0.
・In case (1<a≦2) : X(n) converges to 1-(1/a).
・In case (2<a≦3) : X(n) converges to 1-(1/a) while oscillating.
・In case (3<a≦3.5699456・・・) : X(n) oscillate between the periodic point individual Power of 2
・In case (3.5699456・・・<a≦4) : X(n) Change irregularly.(Chaotic region)*It may become periodically by the value of a.
Please try to observe the changes of Logistic Map by changing the various initial values.
■Main function of App
1. Simulation of changes in colony size
2. Line graph of changes in population
3. Output CSV file(Need to purchase add-on.)
4. Output Graph Image(Need to purchase add-on.)
In-Apps
- Add Output Function
- 0,99 €
Screenshots


Bevölkerung Simulator FAQ
-
Is Bevölkerung Simulator free?
Yes, Bevölkerung Simulator is free to download, however it contains in-app purchases or subscription offerings.
-
Is Bevölkerung Simulator legit?
Not enough reviews to make a reliable assessment. The app needs more user feedback.
Thanks for the vote -
How much does Bevölkerung Simulator cost?
Bevölkerung Simulator has several in-app purchases/subscriptions, the average in-app price is €0.99.
-
What is Bevölkerung Simulator revenue?
To get estimated revenue of Bevölkerung Simulator app and other AppStore insights you can sign up to AppTail Mobile Analytics Platform.

User Rating
App is not rated in Germany yet.
Ratings History
Bevölkerung Simulator Reviews
Store Rankings
Ranking History
App Ranking History not available yet
Category Rankings
App is not ranked yet
Bevölkerung Simulator Competitors
| Name | Downloads (30d) | Monthly Revenue | Reviews | Ratings | Recent release | |
|---|---|---|---|---|---|---|

Waves: Partial Diff Eq
|
Unlock
|
Unlock
|
0
|
|
2 years ago | |

Algorithms (VPP compatible)
Explained and Animated
|
Unlock
|
Unlock
|
0
|
|
3 years ago | |

Overpopulation
|
Unlock
|
Unlock
|
0
|
|
3 years ago | |

NewtonianMechanicsLight
astroDynamicsSimulator
|
Unlock
|
Unlock
|
0
|
|
1 year ago | |

Calculation of Pi
Monte Carlo simulation
|
Unlock
|
Unlock
|
0
|
|
1 year ago | |

Velocity Triangles Analysis
Turbomachinery velocities tool
|
Unlock
|
Unlock
|
0
|
|
3 years ago | |

Tree of Life - ToL App
|
Unlock
|
Unlock
|
0
|
|
1 year ago | |

Mysteries of Fractal
Amazing Math & Fractal Arts
|
Unlock
|
Unlock
|
2
|
|
9 months ago | |

SenseCart
|
Unlock
|
Unlock
|
0
|
|
1 year ago | |

Quarked! Matter Mechanic
|
Unlock
|
Unlock
|
0
|
|
1 year ago |
個体群シミュレーター Installs
Last 30 days
個体群シミュレーター Revenue
Last 30 daysBevölkerung Simulator Revenue and Downloads
Gain valuable insights into 個体群シミュレーター performance with our analytics.
Sign up now to access downloads, revenue, and more.
Sign up now to access downloads, revenue, and more.
App Info
- Category
- Education
- Publisher
-
TAIKI HIRATA

- Languages
- English, Japanese
- Recent release
- 2.0 (1 year ago )
- Released on
- May 30, 2014 (10 years ago )
- Also available in
- Japan, Brazil, China, Mexico, Philippines, Peru, New Zealand, Norway, Netherlands, Nigeria, Malaysia, Poland, Lebanon, Kazakhstan, Kuwait, South Korea, Italy, Pakistan, Israel, Portugal, Romania, Russia, Saudi Arabia, Singapore, Thailand, Türkiye, Taiwan, Ukraine, United States, Vietnam, South Africa, Dominican Republic, Argentina, Austria, Australia, Azerbaijan, Belgium, Belarus, Canada, Switzerland, Chile, Colombia, Czechia, Germany, Denmark, India, Algeria, Ecuador, Egypt, Spain, Finland, France, United Kingdom, Greece, Hong Kong SAR China, Hungary, Indonesia, Ireland, United Arab Emirates
- Last Updated
- 1 week ago