
DataAnalysis
Published by:
Data Evaluation Systems
Description
DataAnalysis is a general purpose iPad App for the plotting and fitting of all types of data that can be formulated as x, y pairs. The program can be easily used by both students and professionals. It is particularly useful for quick analyses of various types of data by curve fitting, value prediction via a standard curve, and analysis of kinetic data including enzyme kinetics.
Data can be entered directly via the keyboard or imported from a text file (.txt), or a comma separated value file (.csv). In addition, data can be pasted from the clipboard.
After data entry the user has the option to average, baseline correct, and/or normalize the data before plotting and fitting.
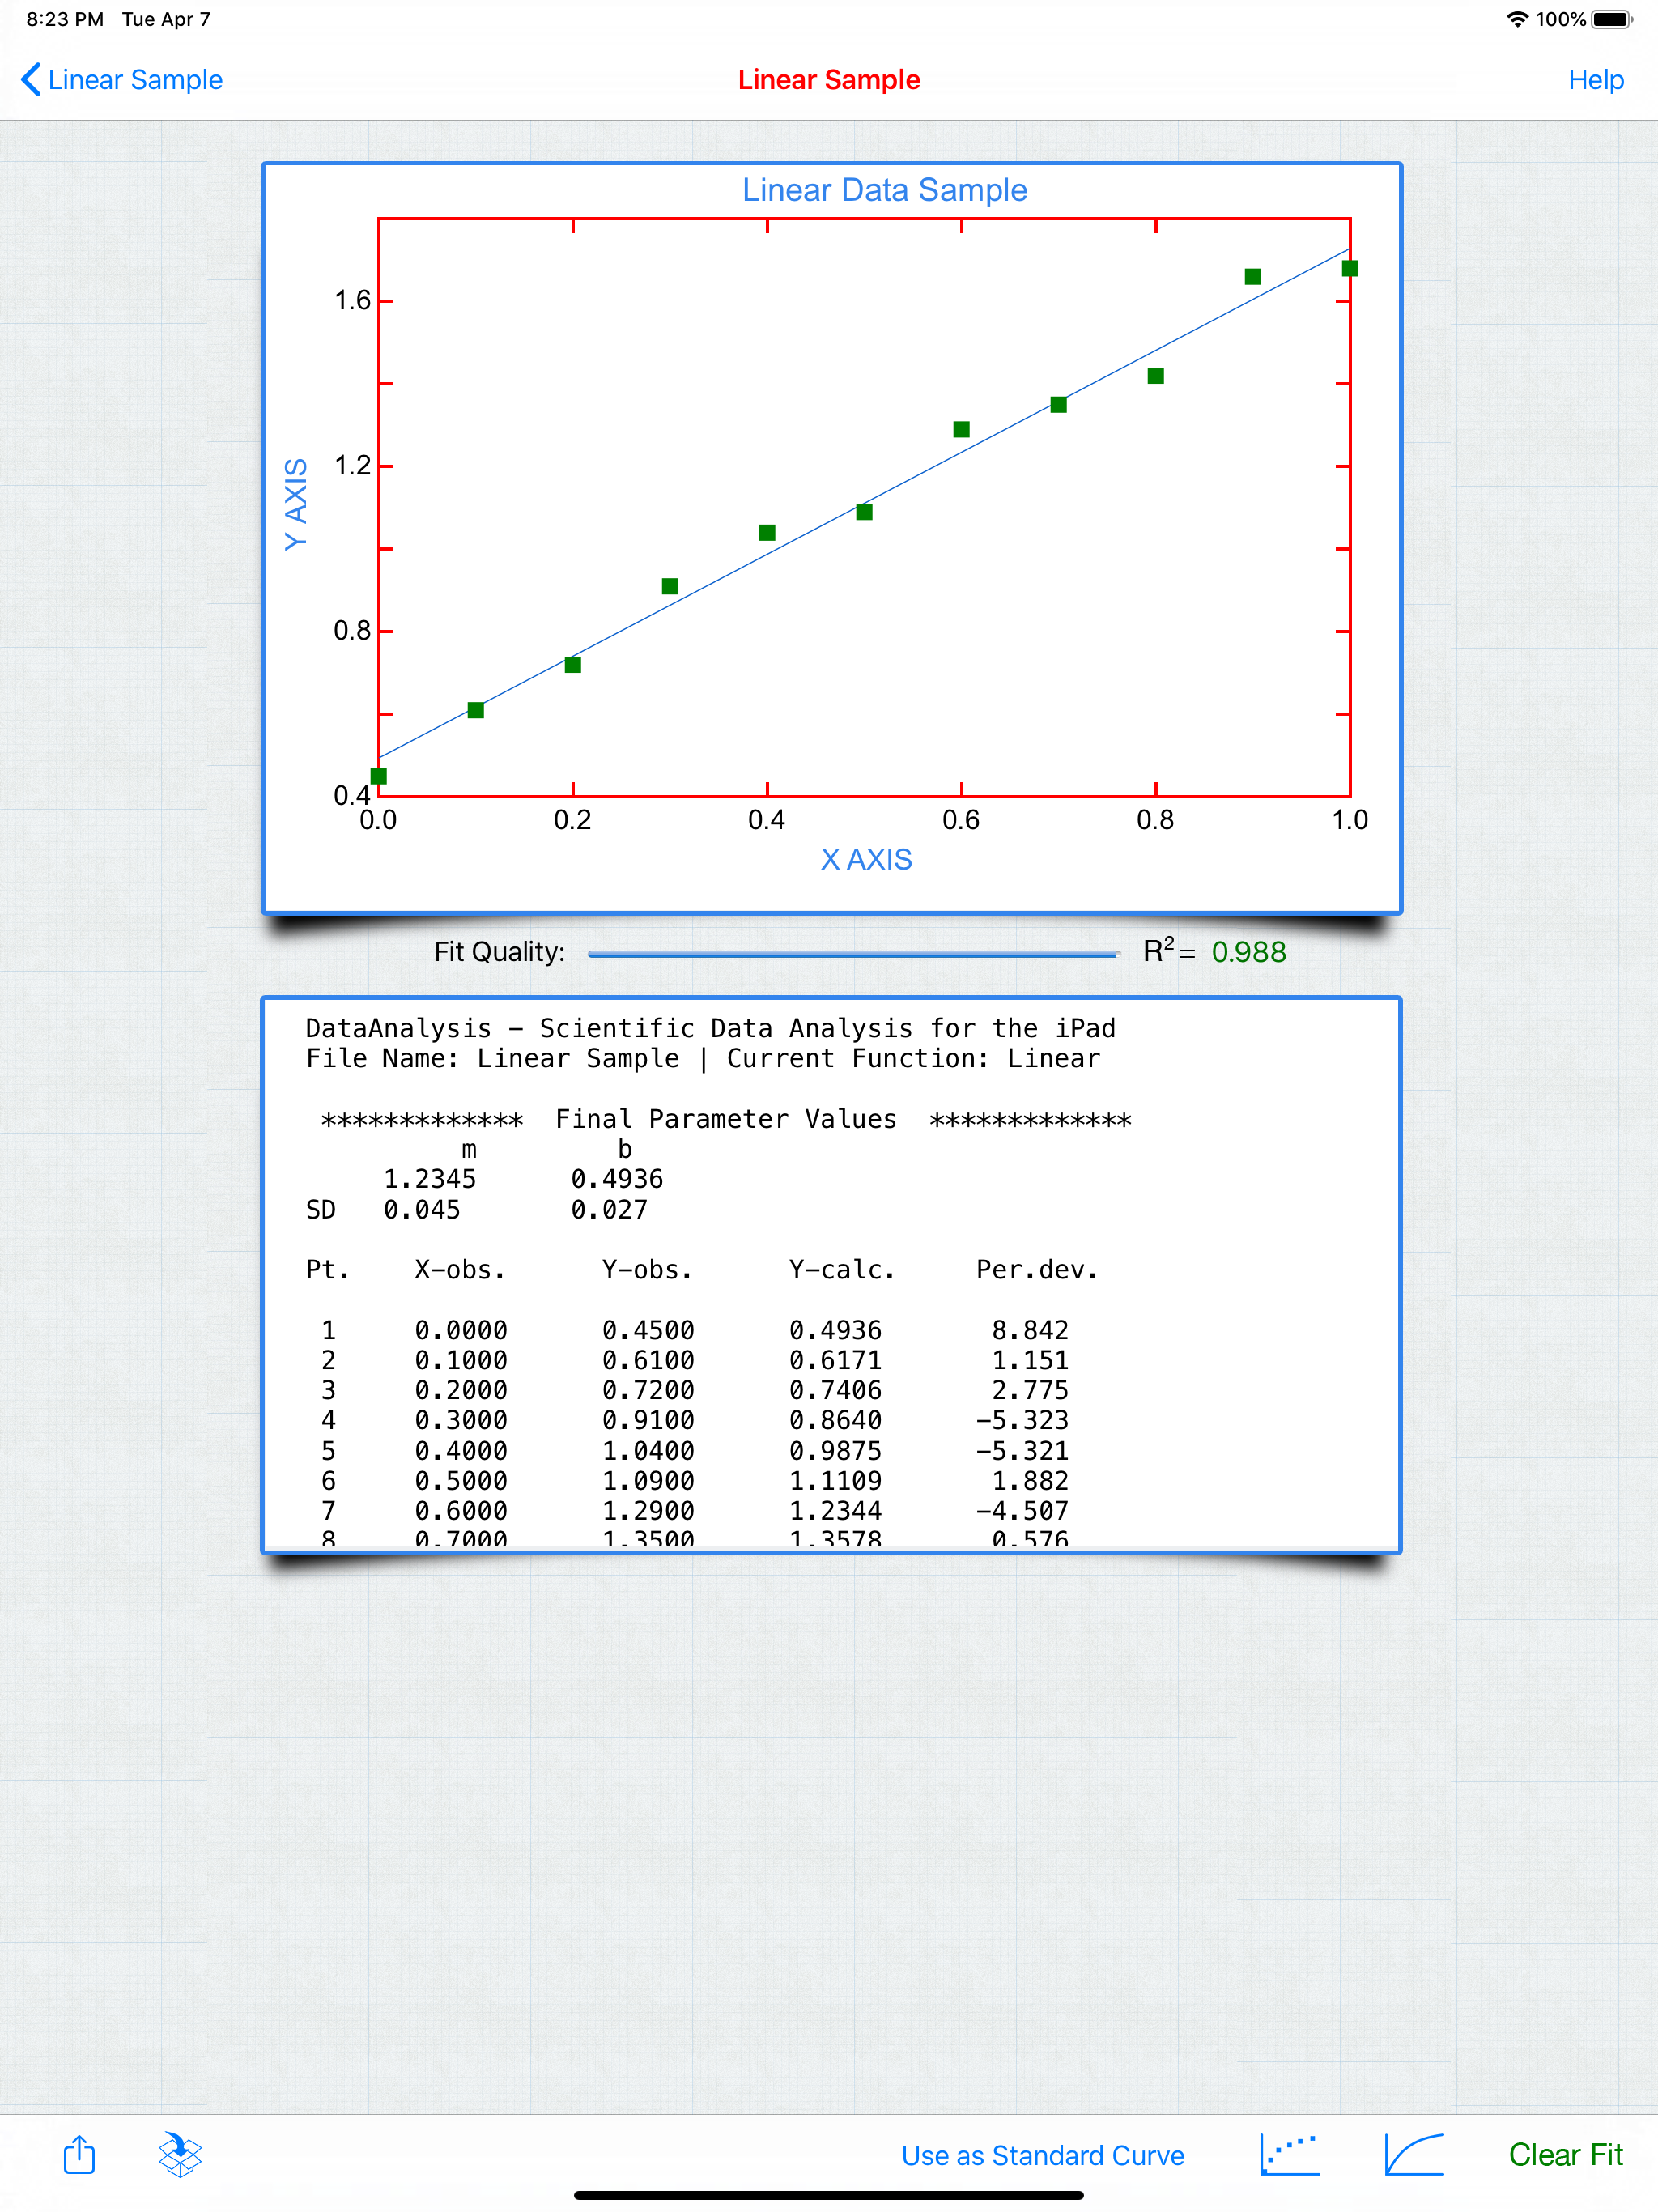
Plotting of the data is as simple as pressing the Plot button. The axes are autoscaled and the graph is immediately ready to add to a document or presentation. The user has a variety of options to customize the graph by altering the axes, axes labels, graph title, and changing the symbol, its size and color.
Using touch and drag the user can create a selection box allowing the creation of a data subset. Once the data subset has been selected the user has two options: (1) To zoom in on the selected data. Any fitting done in this mode is global (e.g. uses all the data). (2) To zoom and perform a fitting only on the selected subset of the data.
The data can be fit to a variety of mathematical equations by non-linear regression including simple functions such as linear, 2nd and 3th order polynomials, power, exponential, and log functions.
Data can also be fit to more complex equations for such processes as radioactive decay, enzyme kinetics, 1st and 2nd order chemical reactions, as well as gaussian, logistics and surge functions. The fit can be overlaid on the data with different line widths, types and thicknesses.
Lowess Regression (LOcal Weighted regrESSion) can also be used to fit data without the need to specify a mathematical function. Not only does Lowess Regression not require a mathematical function, but also does not require parameters (non-parametric). This fitting method is used extensively to fit everything from election polling to astrophysics data, where the data have a large degree of scatter.
For many analytical situations, the data fit can be used as a standard curve to determine the value of unknowns. This analytical procedure is completely automated within DataAnalysis.
The program output, graphics and text, can be copied, emailed, or uploaded to cloud storage such as iCloud, Dropbox, Box and OneDrive in a variety of formats including PDF, PNG, CSV and TXT. The graphics in PDF format can be edited with programs like Adobe Illustrator™ and AutoDesk Graphic™ as objects.
DataAnalysis also supports multitasking and printing of input data as well as all forms of output.
DataAnalysis has built in tool tips, a comprehensive web based User Guide and videos tutorials all available via the Help Menu.
Hide
Show More...
Data can be entered directly via the keyboard or imported from a text file (.txt), or a comma separated value file (.csv). In addition, data can be pasted from the clipboard.
After data entry the user has the option to average, baseline correct, and/or normalize the data before plotting and fitting.
Plotting of the data is as simple as pressing the Plot button. The axes are autoscaled and the graph is immediately ready to add to a document or presentation. The user has a variety of options to customize the graph by altering the axes, axes labels, graph title, and changing the symbol, its size and color.
Using touch and drag the user can create a selection box allowing the creation of a data subset. Once the data subset has been selected the user has two options: (1) To zoom in on the selected data. Any fitting done in this mode is global (e.g. uses all the data). (2) To zoom and perform a fitting only on the selected subset of the data.
The data can be fit to a variety of mathematical equations by non-linear regression including simple functions such as linear, 2nd and 3th order polynomials, power, exponential, and log functions.
Data can also be fit to more complex equations for such processes as radioactive decay, enzyme kinetics, 1st and 2nd order chemical reactions, as well as gaussian, logistics and surge functions. The fit can be overlaid on the data with different line widths, types and thicknesses.
Lowess Regression (LOcal Weighted regrESSion) can also be used to fit data without the need to specify a mathematical function. Not only does Lowess Regression not require a mathematical function, but also does not require parameters (non-parametric). This fitting method is used extensively to fit everything from election polling to astrophysics data, where the data have a large degree of scatter.
For many analytical situations, the data fit can be used as a standard curve to determine the value of unknowns. This analytical procedure is completely automated within DataAnalysis.
The program output, graphics and text, can be copied, emailed, or uploaded to cloud storage such as iCloud, Dropbox, Box and OneDrive in a variety of formats including PDF, PNG, CSV and TXT. The graphics in PDF format can be edited with programs like Adobe Illustrator™ and AutoDesk Graphic™ as objects.
DataAnalysis also supports multitasking and printing of input data as well as all forms of output.
DataAnalysis has built in tool tips, a comprehensive web based User Guide and videos tutorials all available via the Help Menu.
Screenshots


DataAnalysis FAQ
-
Is DataAnalysis free?
Yes, DataAnalysis is completely free and it doesn't have any in-app purchases or subscriptions.
-
Is DataAnalysis legit?
Not enough reviews to make a reliable assessment. The app needs more user feedback.
Thanks for the vote -
How much does DataAnalysis cost?
DataAnalysis is free.
-
What is DataAnalysis revenue?
To get estimated revenue of DataAnalysis app and other AppStore insights you can sign up to AppTail Mobile Analytics Platform.

User Rating
4.14 out of 5
21 ratings in Germany
Ratings History
DataAnalysis Reviews
Store Rankings
Ranking History
App Ranking History not available yet
Category Rankings
App is not ranked yet
DataAnalysis Competitors
| Name | Downloads (30d) | Monthly Revenue | Reviews | Ratings | Recent release | |
|---|---|---|---|---|---|---|

MXTNote
PDF reader, notes, arXiv
|
Unlock
|
Unlock
|
0
|
|
3 months ago | |

VerbTeX LaTeX Editor
|
Unlock
|
Unlock
|
0
|
|
3 weeks ago | |

Data Explorer
Statistics for the rest of us
|
Unlock
|
Unlock
|
0
|
|
1 year ago | |

HSvu
|
Unlock
|
Unlock
|
0
|
|
1 year ago | |

Graph Generator
Attractive, Customizable Chart
|
Unlock
|
Unlock
|
0
|
|
2 years ago | |

Plot Digitizer
Get data from 2D XY Plots
|
Unlock
|
Unlock
|
0
|
|
2 years ago | |

Diagramm - Plotter
|
Unlock
|
Unlock
|
0
|
|
2 years ago | |

Daviz
|
Unlock
|
Unlock
|
0
|
|
3 years ago | |

Graph
|
Unlock
|
Unlock
|
0
|
1
|
1 week ago | |

Number Analytics
|
Unlock
|
Unlock
|
0
|
|
1 year ago |
DataAnalysis Installs
Last 30 days
DataAnalysis Revenue
Last 30 daysDataAnalysis Revenue and Downloads
Gain valuable insights into DataAnalysis performance with our analytics.
Sign up now to access downloads, revenue, and more.
Sign up now to access downloads, revenue, and more.
App Info
- Category
- Productivity
- Publisher
- Data Evaluation Systems
- Languages
- English
- Recent release
- 4.11 (3 years ago )
- Released on
- Jun 20, 2010 (14 years ago )
- Also available in
- United States , China , United Kingdom , Australia , Germany , Thailand , Italy , France , Mexico , Russia , Netherlands , Spain , Hong Kong SAR China , Brazil , Singapore , Indonesia , Portugal , Poland , Philippines , Türkiye , Denmark , Colombia , Chile , Canada , Saudi Arabia , Vietnam , Argentina , New Zealand , Norway , Malaysia , Belgium , United Arab Emirates , Peru , Kazakhstan , Kuwait , Egypt , Ecuador , Algeria , South Africa
- Last Updated
- 2 weeks ago
This page includes copyrighted content from third parties, shared solely for commentary and research in accordance with fair use under applicable copyright laws. All trademarks, including product, service, and company names or logos, remain the property of their respective owners. Their use here falls under nominative fair use as outlined by trademark laws and does not suggest any affiliation with or endorsement by the trademark holders.