
Dow Jones 30 Stocks Heat Map
#1 Keyword Rankings
Today
Top 10 Rankings
Today
Top 30 Rankings
Today
Top 100 Rankings
Today
Description
.Dow Jones 30 Industry Stocks Market Map
.Intraday Market Data update every minute when stock market opens
.High, Low, Open, Close, ROI (Gain), Volume, Average Volume, Price strength and volume momentum data.
."Strength" measures strength of the price movement of a stock compared to other stocks.
."Momentum" measures trading volume of a stock compared to its own average volume.
.The "Average Volume" and "Momentum" numbers are adjusted to the portion of the current trading period automatically. They are also normalized to the high volume movements at market open and before market close.
The "Average Volume" and "Momentum" numbers include trading volumes in after-market hours (4 - 8pm Eastern Time). The numbers at 4pm are not 100% of the daily trading volumes, but are at 84% to 89% of the daily volumes.
.Intraday price chart (new feature in version 3) for stocks.
.Colorful representation of gain and loss.
.Block size represents weight of each stock within the index.
.Dow Jones 30 Industry stocks compositions and allocations.
.Company fundamental data including market cap, earnings, dividend, price target, ... and much more.
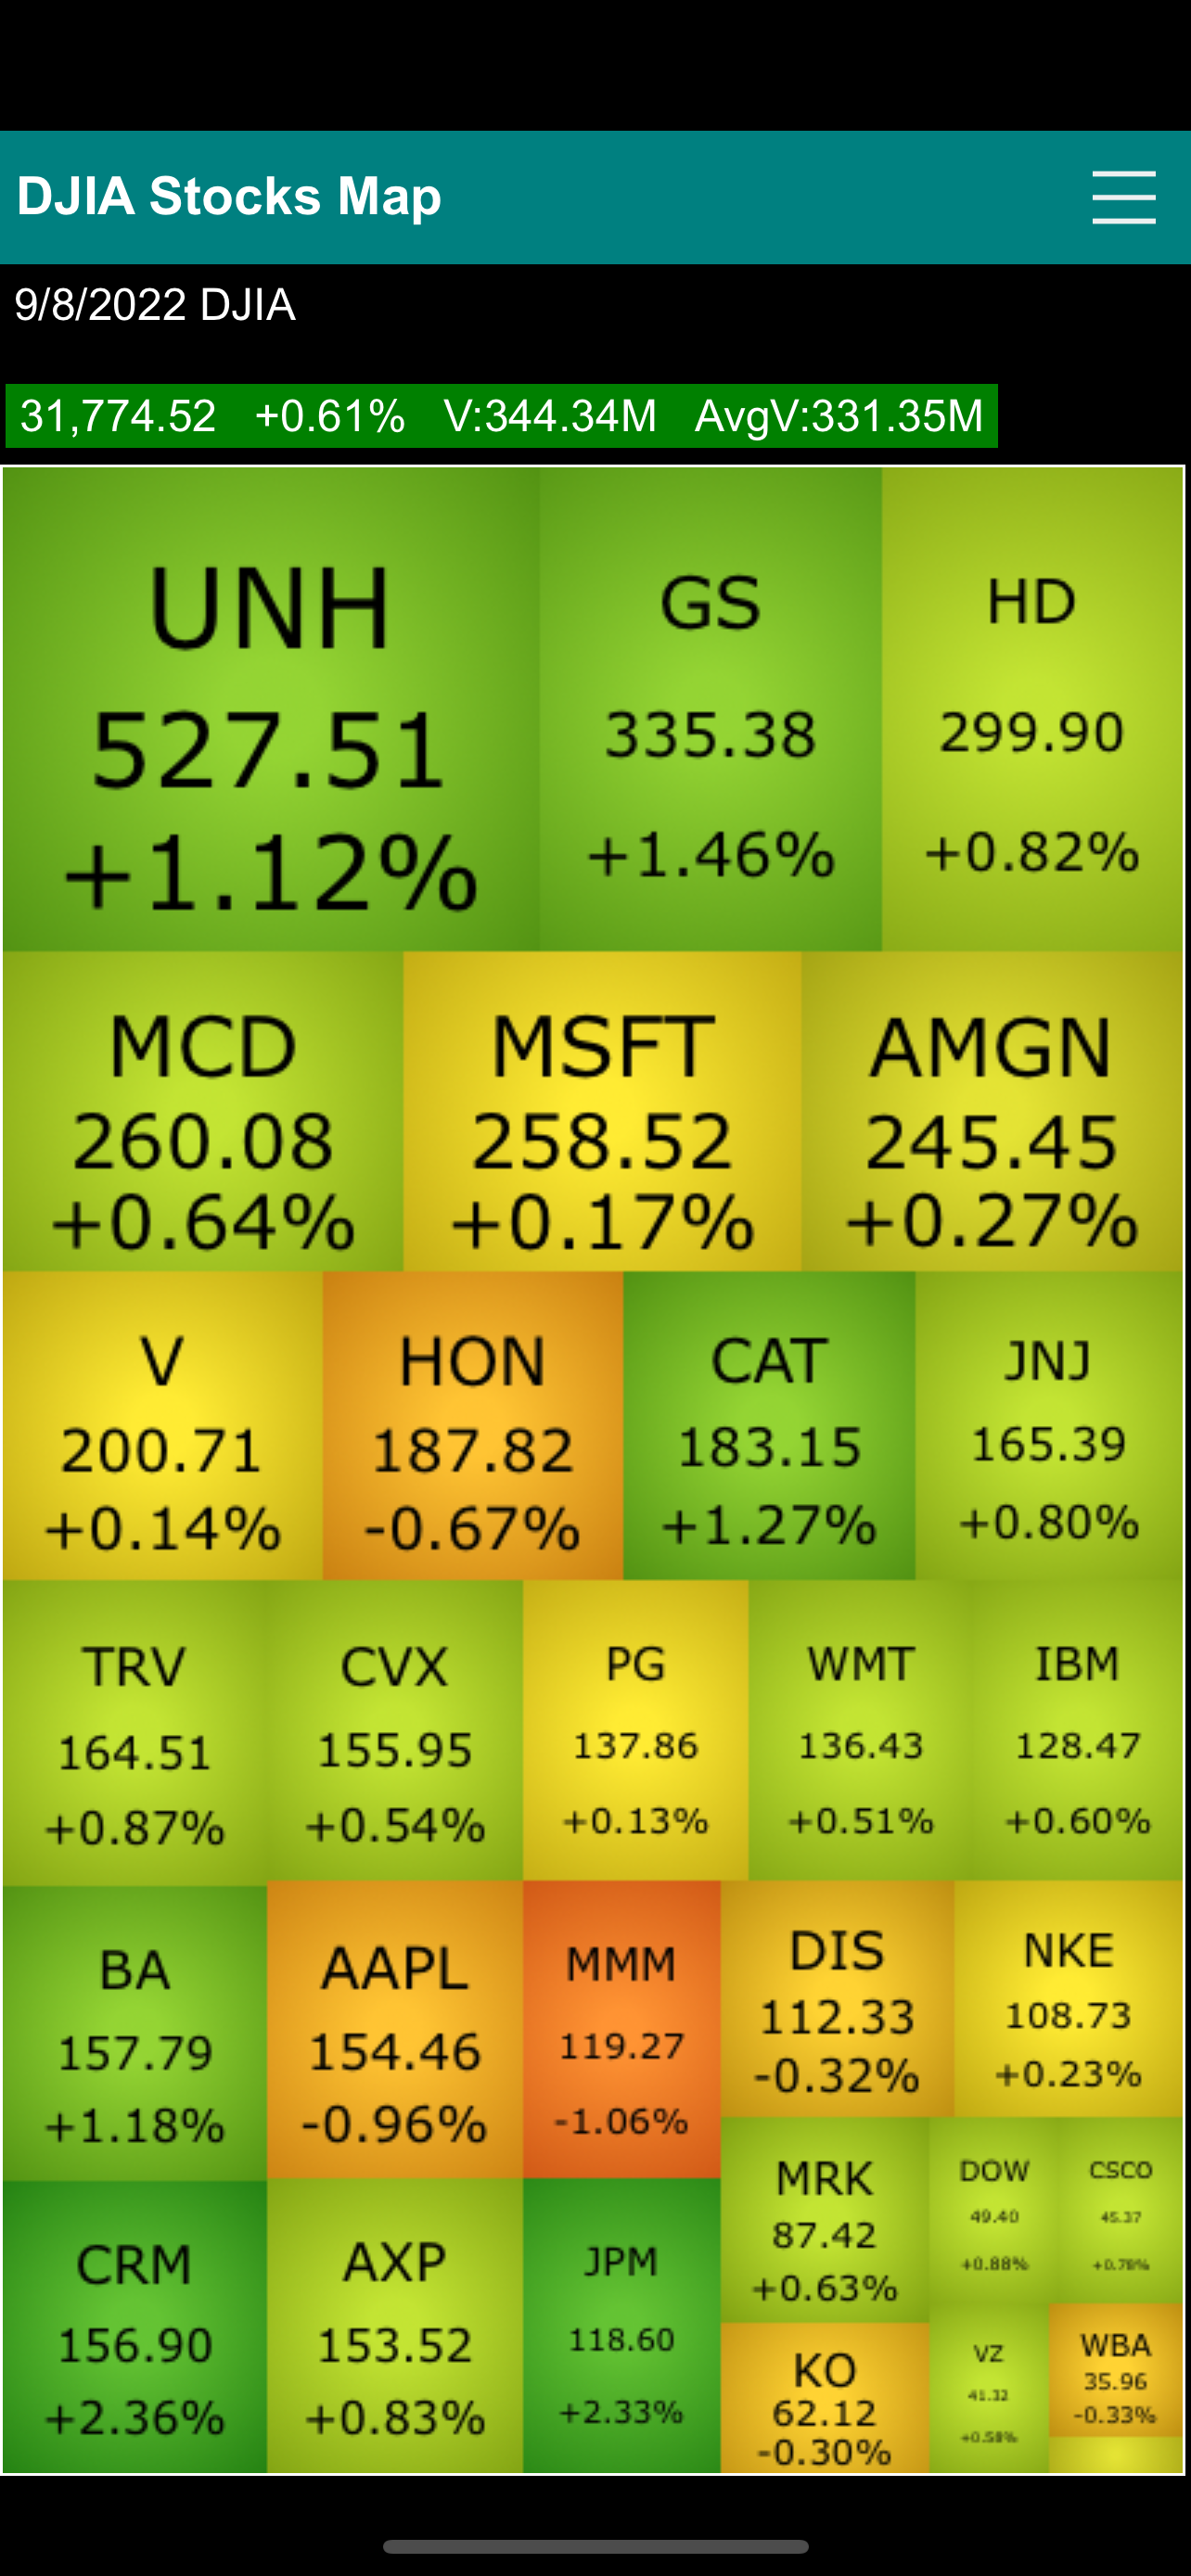
Stock market map (a.k.a. market heat map or market tree map) is a visual representation stock market data. It is an investment research tool let you quickly view the performance of different stocks. The size of the block in the map represents the values of the component within the portfolio. The color of the block represents ROI (price gain) of the component. The overall performance of the portfolio can be easily grasped by a glimpse to the map by the color and size of the blocks.
Tapping a block brings up a popup box showing the name, daily closing price, daily gain, daily volume and the 13 week average volume of the stock. The name of each component is labeled on top of each block. Market data are updated every minute.
Double tap a stock shows company fundamental data when double tap on a stock map. The fundamental data include Market capitalization, outstanding shares, EBITDA, PEG Ratio, Dividend per share, forward and trailing dividend rate and yield, dividend payout date, ex div date, P/E, trailing and forward PE, price/sales, short ratio, book value, price/book, price target, current and forward EPS, EPS report date, EPS ttm, Basic EPA, Diluted EPS, High/Low EPS estimation, number of analysts.
Hide..
Show more..
.Intraday Market Data update every minute when stock market opens
.High, Low, Open, Close, ROI (Gain), Volume, Average Volume, Price strength and volume momentum data.
."Strength" measures strength of the price movement of a stock compared to other stocks.
."Momentum" measures trading volume of a stock compared to its own average volume.
.The "Average Volume" and "Momentum" numbers are adjusted to the portion of the current trading period automatically. They are also normalized to the high volume movements at market open and before market close.
The "Average Volume" and "Momentum" numbers include trading volumes in after-market hours (4 - 8pm Eastern Time). The numbers at 4pm are not 100% of the daily trading volumes, but are at 84% to 89% of the daily volumes.
.Intraday price chart (new feature in version 3) for stocks.
.Colorful representation of gain and loss.
.Block size represents weight of each stock within the index.
.Dow Jones 30 Industry stocks compositions and allocations.
.Company fundamental data including market cap, earnings, dividend, price target, ... and much more.
Stock market map (a.k.a. market heat map or market tree map) is a visual representation stock market data. It is an investment research tool let you quickly view the performance of different stocks. The size of the block in the map represents the values of the component within the portfolio. The color of the block represents ROI (price gain) of the component. The overall performance of the portfolio can be easily grasped by a glimpse to the map by the color and size of the blocks.
Tapping a block brings up a popup box showing the name, daily closing price, daily gain, daily volume and the 13 week average volume of the stock. The name of each component is labeled on top of each block. Market data are updated every minute.
Double tap a stock shows company fundamental data when double tap on a stock map. The fundamental data include Market capitalization, outstanding shares, EBITDA, PEG Ratio, Dividend per share, forward and trailing dividend rate and yield, dividend payout date, ex div date, P/E, trailing and forward PE, price/sales, short ratio, book value, price/book, price target, current and forward EPS, EPS report date, EPS ttm, Basic EPA, Diluted EPS, High/Low EPS estimation, number of analysts.
In-Apps
- App Registration
- $24.99
Screenshots


 User Rating
0 out of 5
0 ratings in Canada
Ratings History
Reviews
App doesn't have any reviews yet
Store Rankings
Ranking History
App Ranking History not available yet
Category Rankings
App is not ranked yet
Keywords
Users may also like
| Name | Reviews | Recent release | |
|---|---|---|---|

Trading Companion and Screener
Stock Market Screener Calendar
|
1
|
1 year ago | |

Nasdaq100 Tech Heatwave
|
0
|
2 years ago | |

ezStocksPro-Watchlist Earnings
Watchlist,Earnings,Charts,News
|
5
|
1 year ago | |

HeatMap: Visual Stock Map
Real-time Stock Market Heatmap
|
0
|
1 week ago | |

Stock Map: S&P 500 and More
Stock market at a glance
|
0
|
11 months ago | |

Indices Heatwave Indexes tool
Stock market Index analysis
|
0
|
3 years ago | |

Stock Bubble
|
0
|
3 years ago | |

Global Stock Market
World Stock Indices
|
0
|
1 month ago | |

S&P Stocks Ratings & Charts
Investing Powered by AI
|
1
|
2 weeks ago | |

Stock Market Status
Market Watch
|
0
|
2 years ago |
Show More
Revenue and Downloads
Gain valuable insights into Dow Jones 30 Stocks Heat Map performance with our analytics. Sign up now
to
access downloads, revenue, and more.
App Info
- Category
- Finance
- Publisher
- George Kung
- Languages
- English
- Recent version
- 3.5.0 (1 year ago )
- Released on
- Jul 2, 2021 (3 years ago )
- Also available in
- United States, South Africa, Italy, India, Japan, South Korea, Kuwait, Kazakhstan, Lebanon, Mexico, Malaysia, Nigeria, Netherlands, Norway, New Zealand, Peru, Philippines, Pakistan, Poland, Portugal, Romania, Russia, Saudi Arabia, Sweden, Singapore, Thailand, Turkey, Taiwan, Ukraine, Vietnam, Denmark, Argentina, Austria, Australia, Azerbaijan, Belgium, Brazil, Belarus, Canada, Switzerland, Chile, China, Colombia, Czechia, Germany, United Arab Emirates, Dominican Republic, Algeria, Ecuador, Egypt, Spain, France, United Kingdom, Greece, Hong Kong, Hungary, Indonesia, Ireland, Israel
- Last updated
- 2 months ago