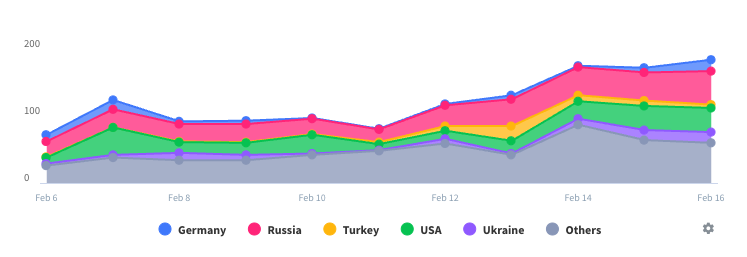
It would be even better to have a pire chart showing the overall usage
The app has been a easy-to-use experience for me, but sometimes I would like to have a impulsive overview on how much I have spent on certain category by percentage or proportion! So it may be an even better experience if I can have a pie chart seeing my usage


