
Math Graphing Lite - Dynamic Scientific Calculator
Description
"Math Graphing" can help students improve their math skills by developing some visual intuition of mathematical expressions or advanced users who need some scientific capabilities only available with expensive desktop software.
MATH GRAPHING provides the following functionalities:
- Multiple expressions with quasi-unlimited number of variables can be combined to produce simple or complex formulas.
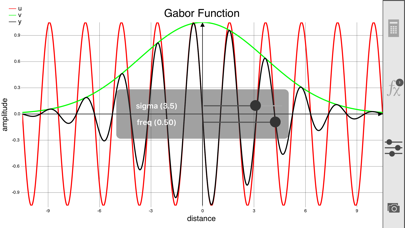
- Interactive sliders can be created to visually investigate the role of important parameters on the graphical representation of the formulas.
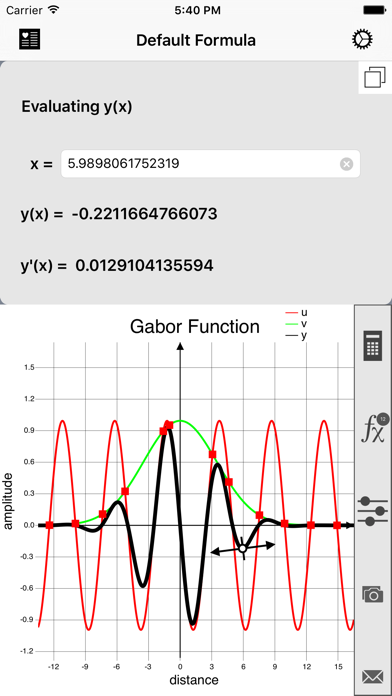
- Trace mode to display coordinates and derivative of marker on selected curve.
- Landscape mode for graphing.
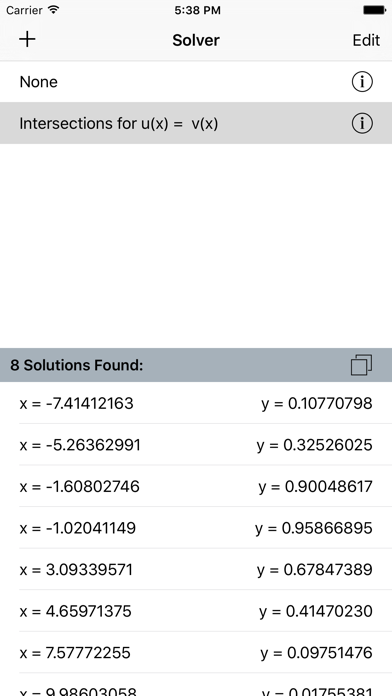
- Solver tool to solve y = f(x) where x or y are unknown, local/global minima/maxima/extrema or intersections g(x) = f(x).
- Formula graphs can be saved to the device's Photos Album and the formulas can be exported through email with embedded graphs.
- Add any formula or calculation to your list of favorites (in-app purchase).
- Several formulas can be plotted simultaneously in different colors and styles.
- Customizable graph appearance: axes labels and ranges, title, curve color and style, ticks number, grid, legends, etc.
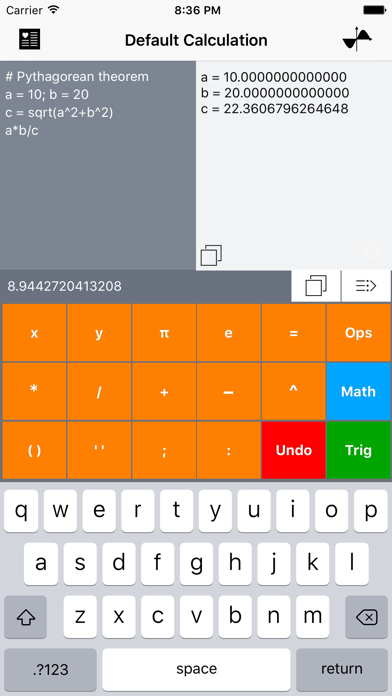
- A single-precision calculator supporting multiple variables.
Example of mathematical expression:
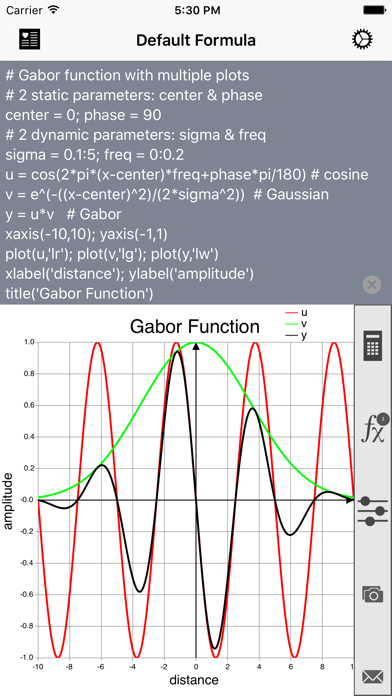
# Gabor function with multiple plots
# 2 static parameters: center & phase
center = 0; phase = 90
# 2 dynamic parameters: sigma & freq
sigma = 1:50; freq = 0:0.2
u = cos(2*pi*(x-50)*freq+phase*pi/180)
v = e^(-((x-center)^2)/(2*sigma^2))
y = u*v
plot(u,'lr'); plot(v,'lg'); plot(y,'lw')
xlabel('distance'); ylabel('amplitude')
title('Gabor Function')
Please visit our "Math Graphing" web page (http://ios.kybervision.com/mathgraphing/) to learn more about "Math Graphing"!
About KyberVision Japan LLC: we provide consulting, research and development services in Vision Sciences. We also develop vision-related applications for the iPad/iPhone/iPod Touch platform, that are spin-off products of Psykinematix, our Mac OS X flagship product in the field of Visual Psychophysics. Feel free to subscribe to our newsletter at http://iphone.kybervision.com.
In-Apps
- PowerPack
- $6.99
- PowerUpgrade
- $2.99
- Graphing Pack
- $3.99
- Calculator Pack
- $3.99
Screenshots
Math Graphing Lite FAQ
-
Is Math Graphing Lite free?
Yes, Math Graphing Lite is free to download, however it contains in-app purchases or subscription offerings.
-
Is Math Graphing Lite legit?
Not enough reviews to make a reliable assessment. The app needs more user feedback.
Thanks for the vote -
How much does Math Graphing Lite cost?
Math Graphing Lite has several in-app purchases/subscriptions, the average in-app price is $4.49.
-
What is Math Graphing Lite revenue?
To get estimated revenue of Math Graphing Lite app and other AppStore insights you can sign up to AppTail Mobile Analytics Platform.

5 out of 5
2 ratings in Canada
Math Graphing Lite Reviews
Store Rankings
Keywords
Math Graphing Lite Competitors
Math Graphing Lite Installs
Last 30 days
Math Graphing Lite Revenue
Last 30 daysMath Graphing Lite Revenue and Downloads
Sign up now to access downloads, revenue, and more.
App Info
- Category
- Education
- Publisher
- KYBERVISION JAPAN
- Languages
- English
- Recent release
- 2.0.1 (8 years ago )
- Released on
- Dec 31, 2011 (13 years ago )
- Also available in
- Germany, United Kingdom, Mexico, Italy, France, Sweden, Australia, Netherlands, Japan, Spain, Russia, Switzerland, Poland, Austria, Belgium, Colombia, Portugal, Brazil, Israel, Hong Kong SAR China, China, United States, Singapore, Norway, Denmark, Estonia, Argentina, Chile, New Zealand, Canada, South Korea, Türkiye, India, Greece, Peru, Latvia, Slovakia, United Arab Emirates, Sri Lanka, Ireland, Egypt, Lithuania, Kazakhstan, Kuwait, Malta, South Africa, Armenia, Algeria, Pakistan, Azerbaijan, Brunei, Uzbekistan, Madagascar, Hungary, Cyprus, North Macedonia, Luxembourg, Ukraine, Finland, Vietnam, Ecuador, Indonesia, Nepal, Tunisia, Bahrain, Czechia, Belarus, Slovenia, Saudi Arabia, Dominican Republic, Lebanon, Thailand, Bulgaria, Romania, Malaysia, Nigeria, Iceland, Croatia, Philippines
- Last Updated
- 5 months ago