
Description
Use the Stock Trade Entry Point application to find trading opportunities as well as optimal entering and exiting prices and other setup for trades to maximize profits and minimize risks.
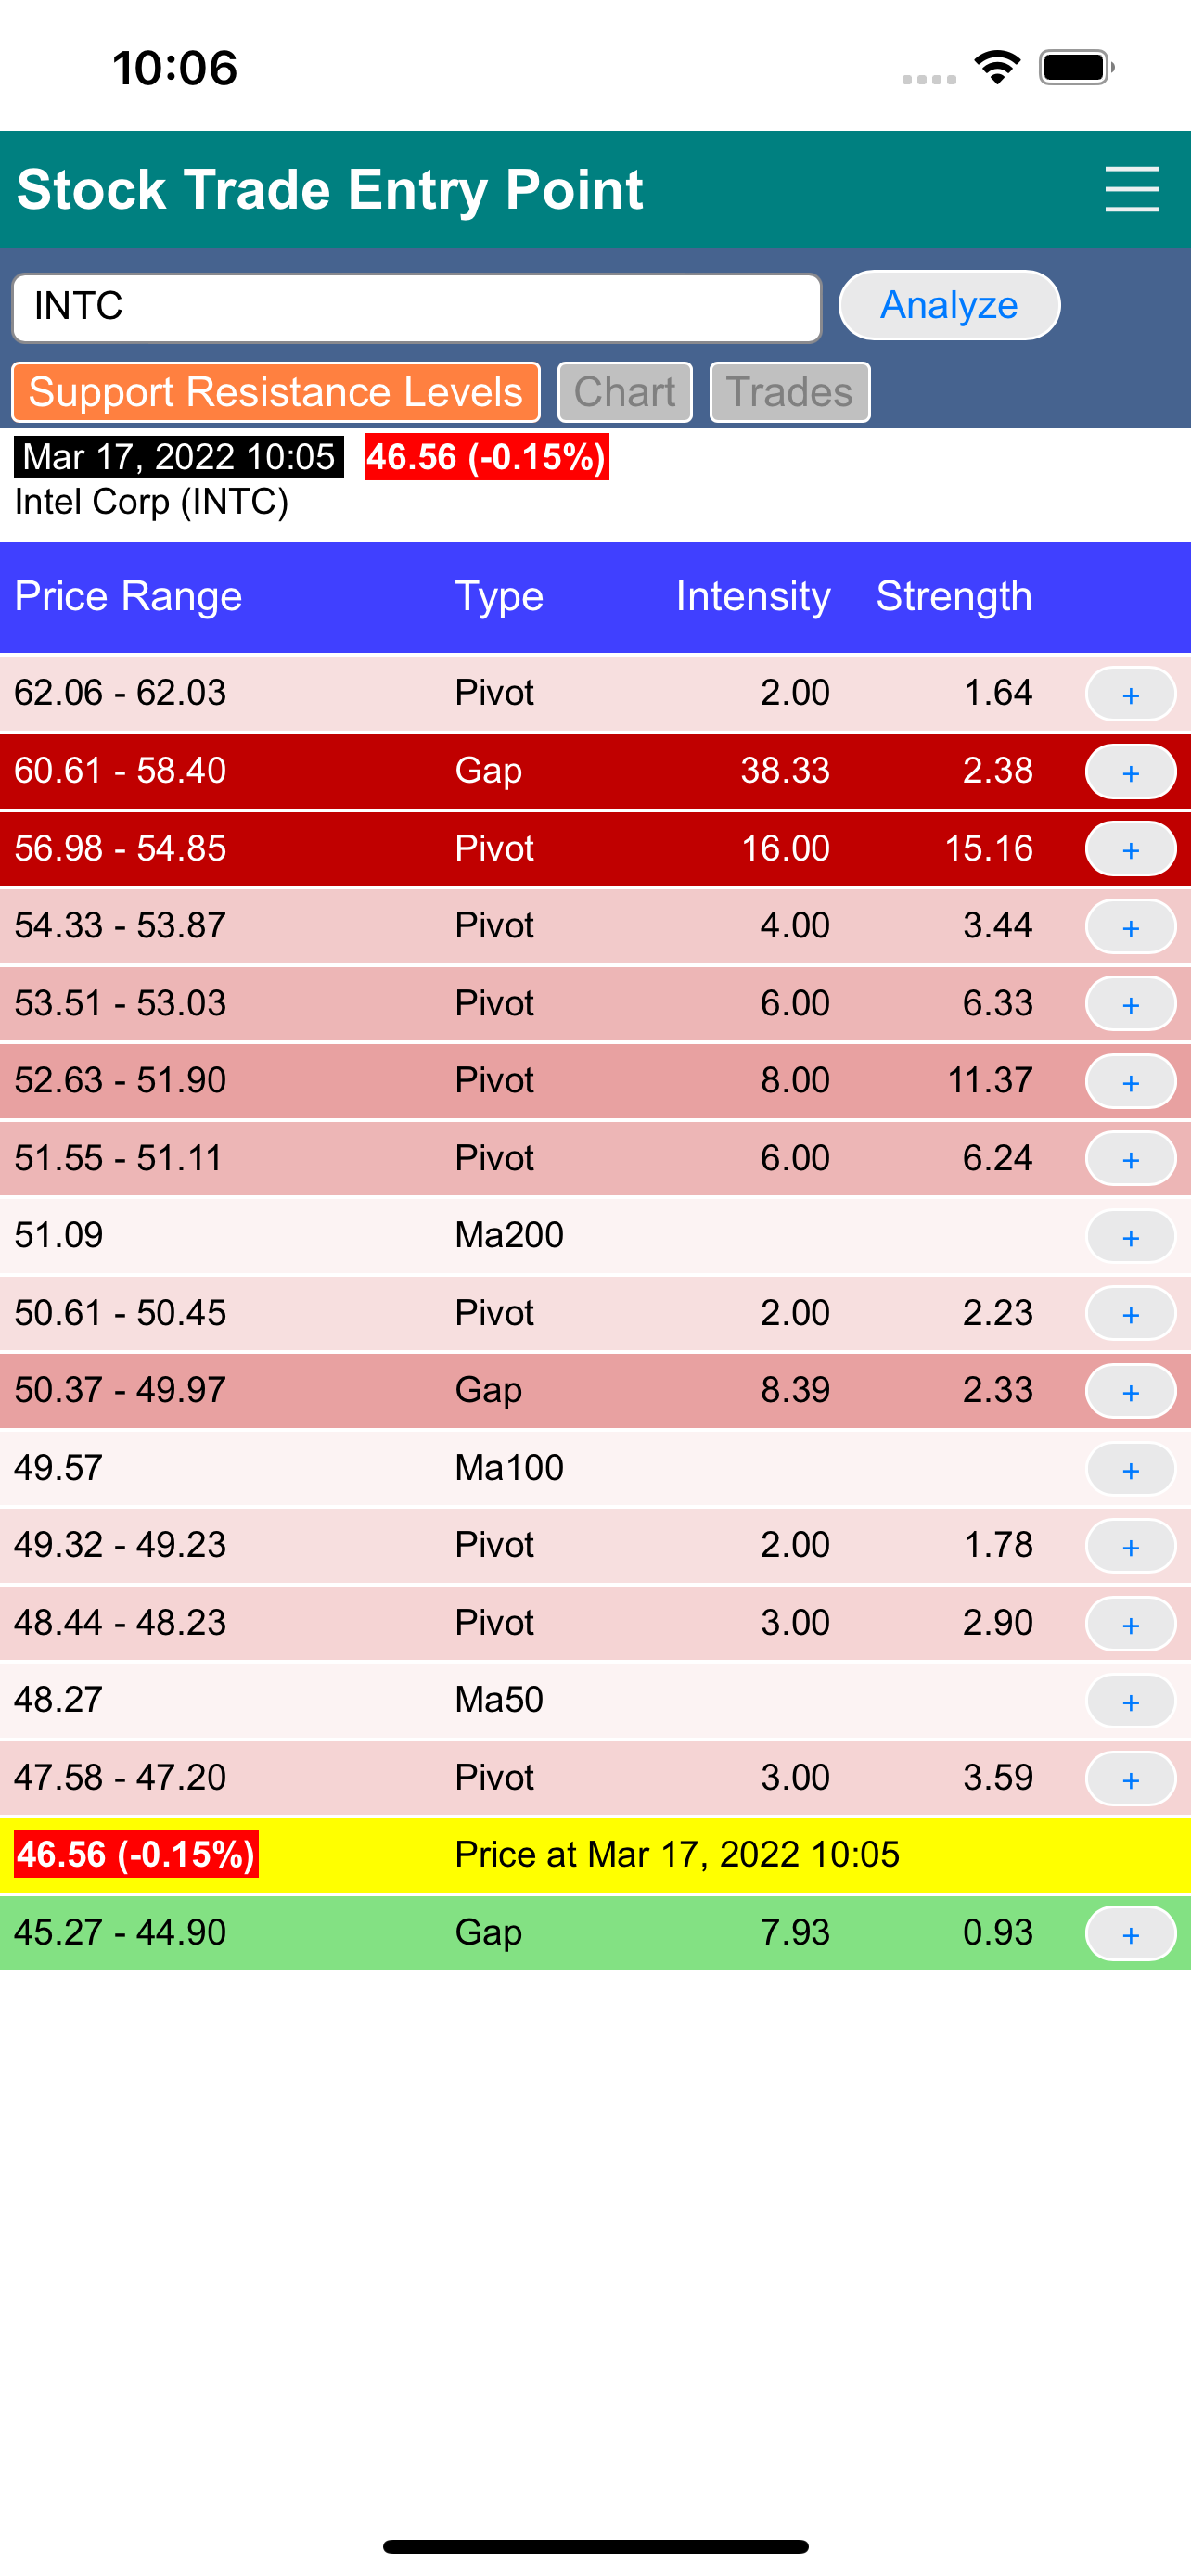
The analysis starts with finding support and resistance levels based on pivot points, gaps and major moving averages commonly used by traders. The strength of each support and resistance level is further determined by various characteristics of the levels including number of occurrences, volume strength and number of times they have succeeded or failed with providing support or resistance in the past, etc.
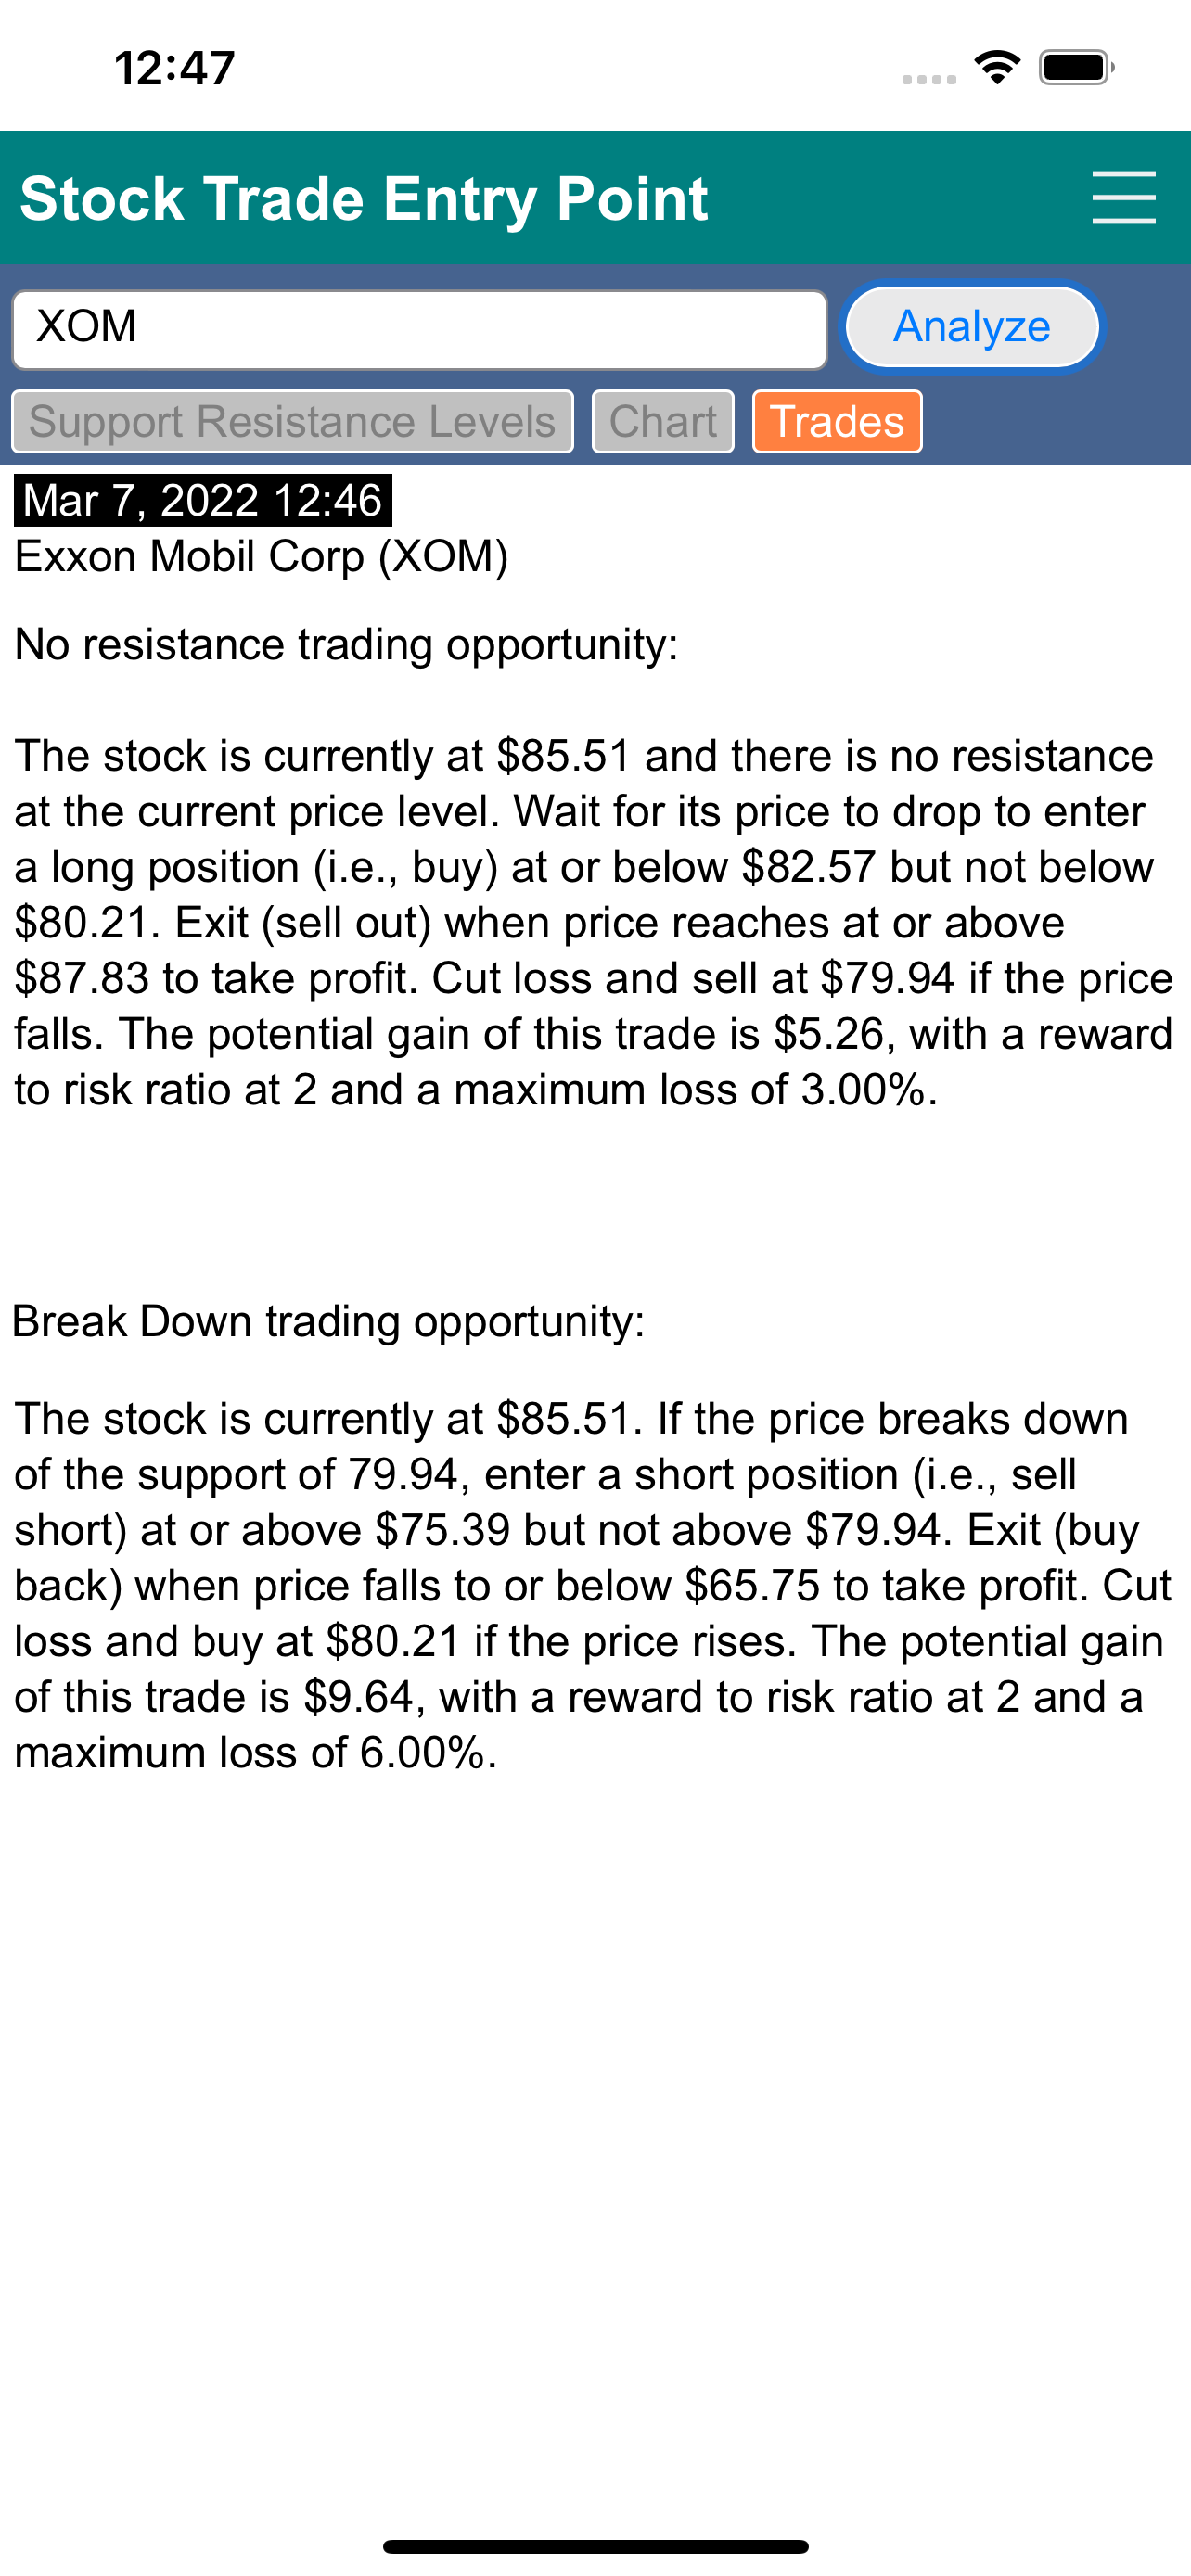
When US market is open, the analysis takes the real time price of the stock (or ETF) in comparison with its support and resistance levels to find suitable trading opportunities. Range bound strategy looks for a large price swing between strong support and resistance levels. Break out strategy looks for opportunities for a price movement to penetrate a resistance level and for the previous resistance level to become support. Break down strategy works similarly to the break out strategy but for the price going in the other direction. There are also cases when the price is going for a ride without any resistance or taking a dive without any support.
Once a suitable trading opportunity is found, the analyzer calculates the entering price with the setup criteria, exit price and cut loss price as well as the gain, maximum losses percentage, and reward-to-risk ratio.
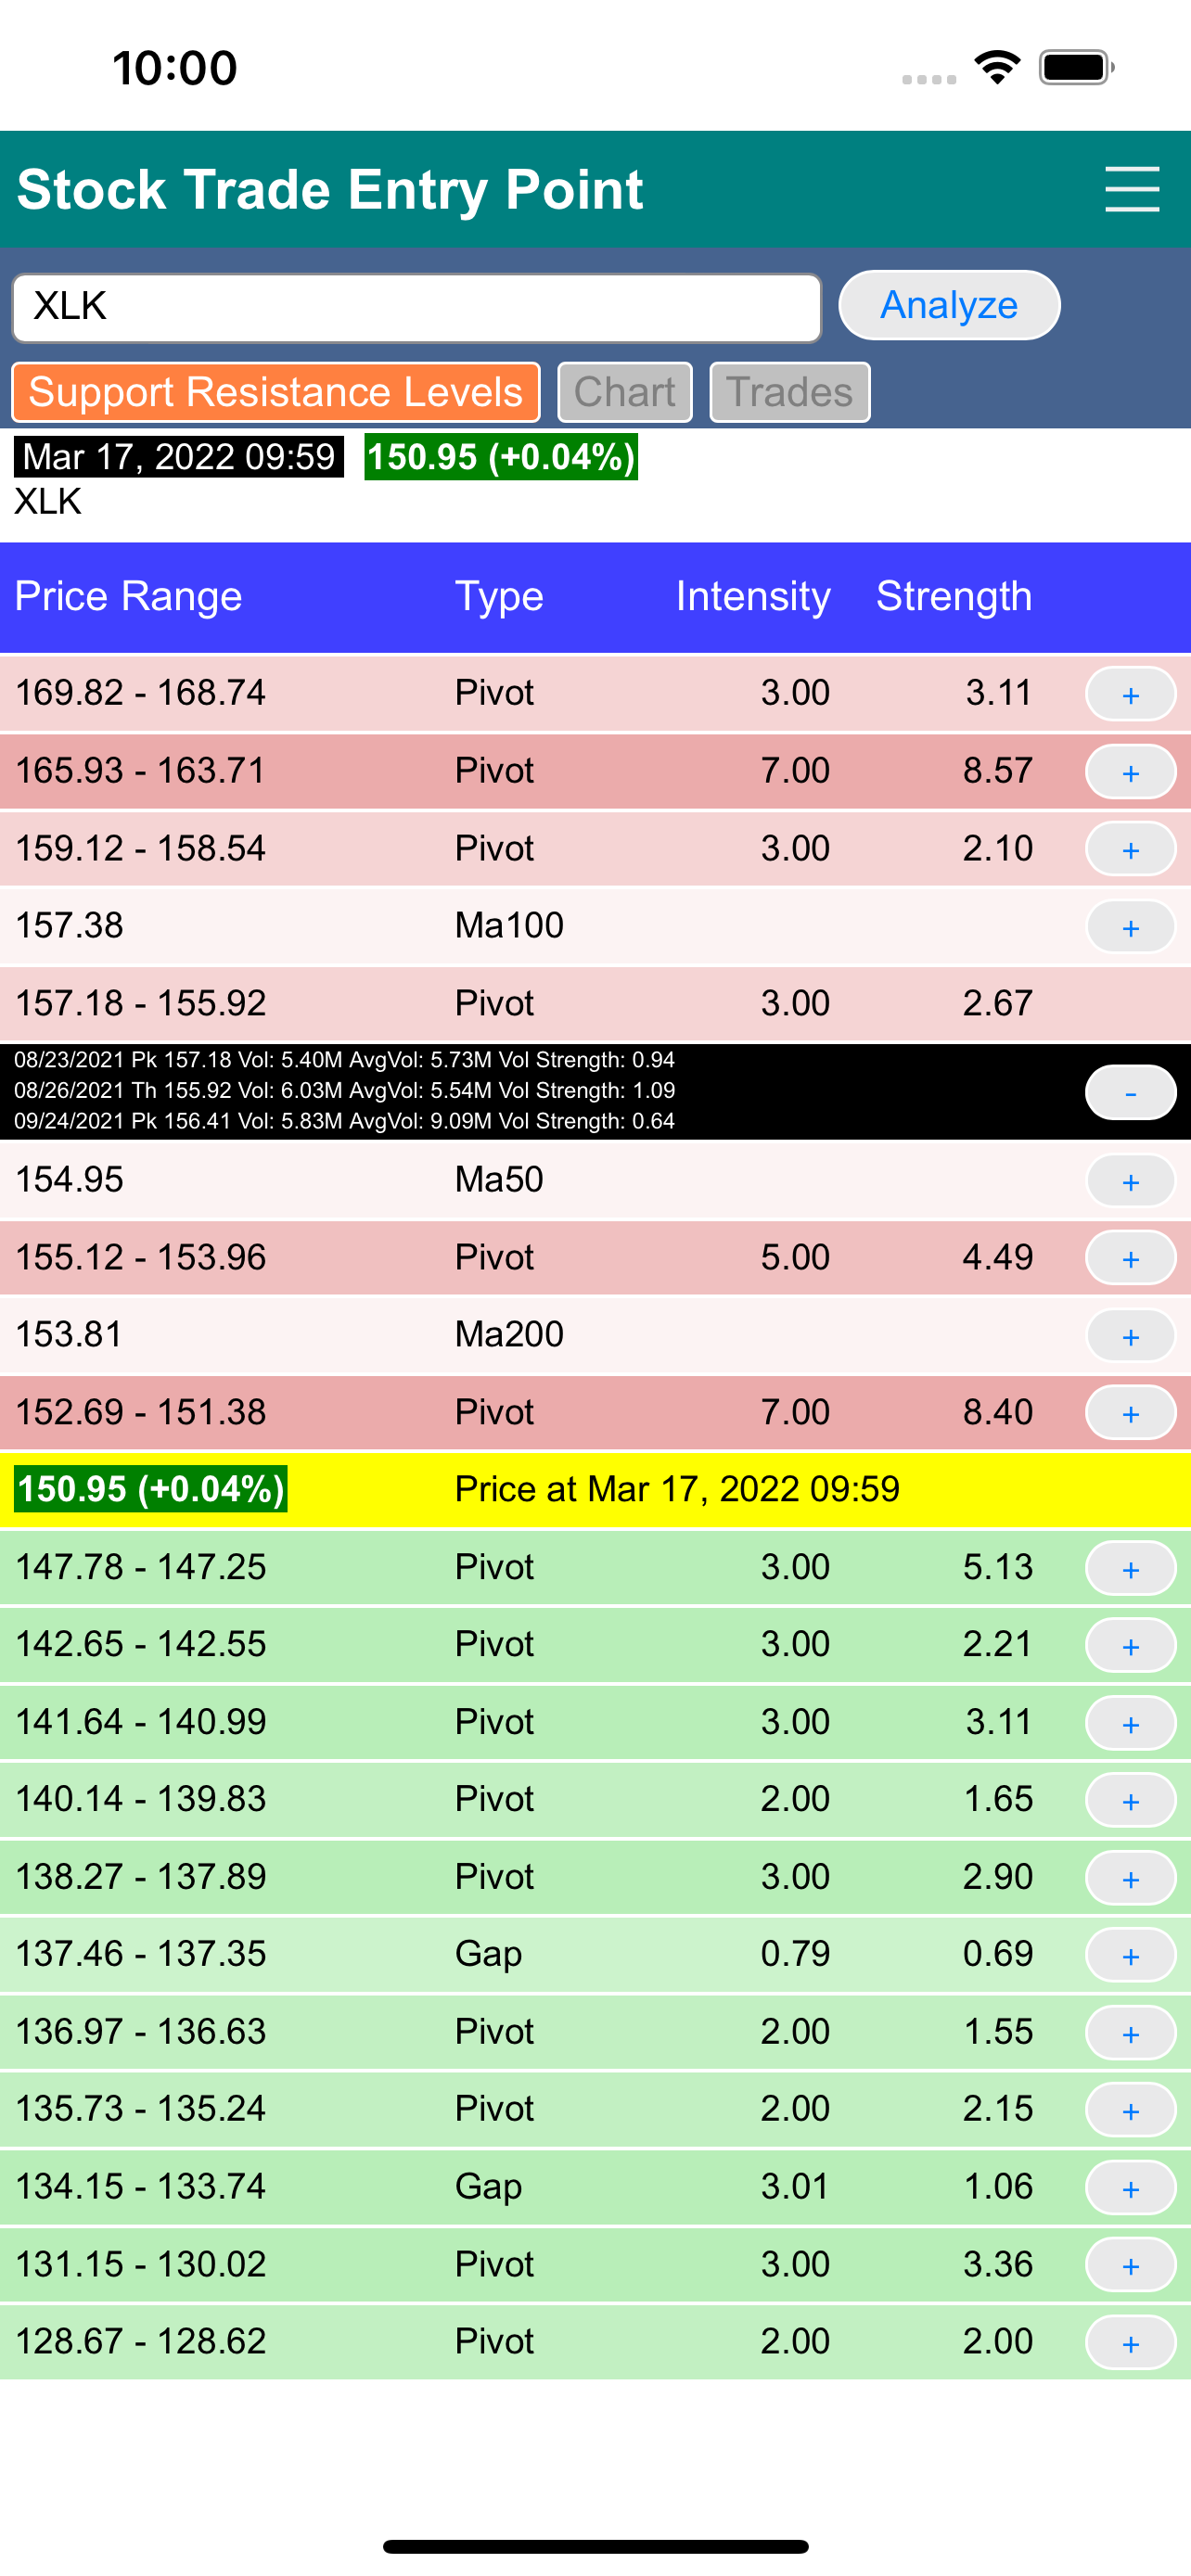
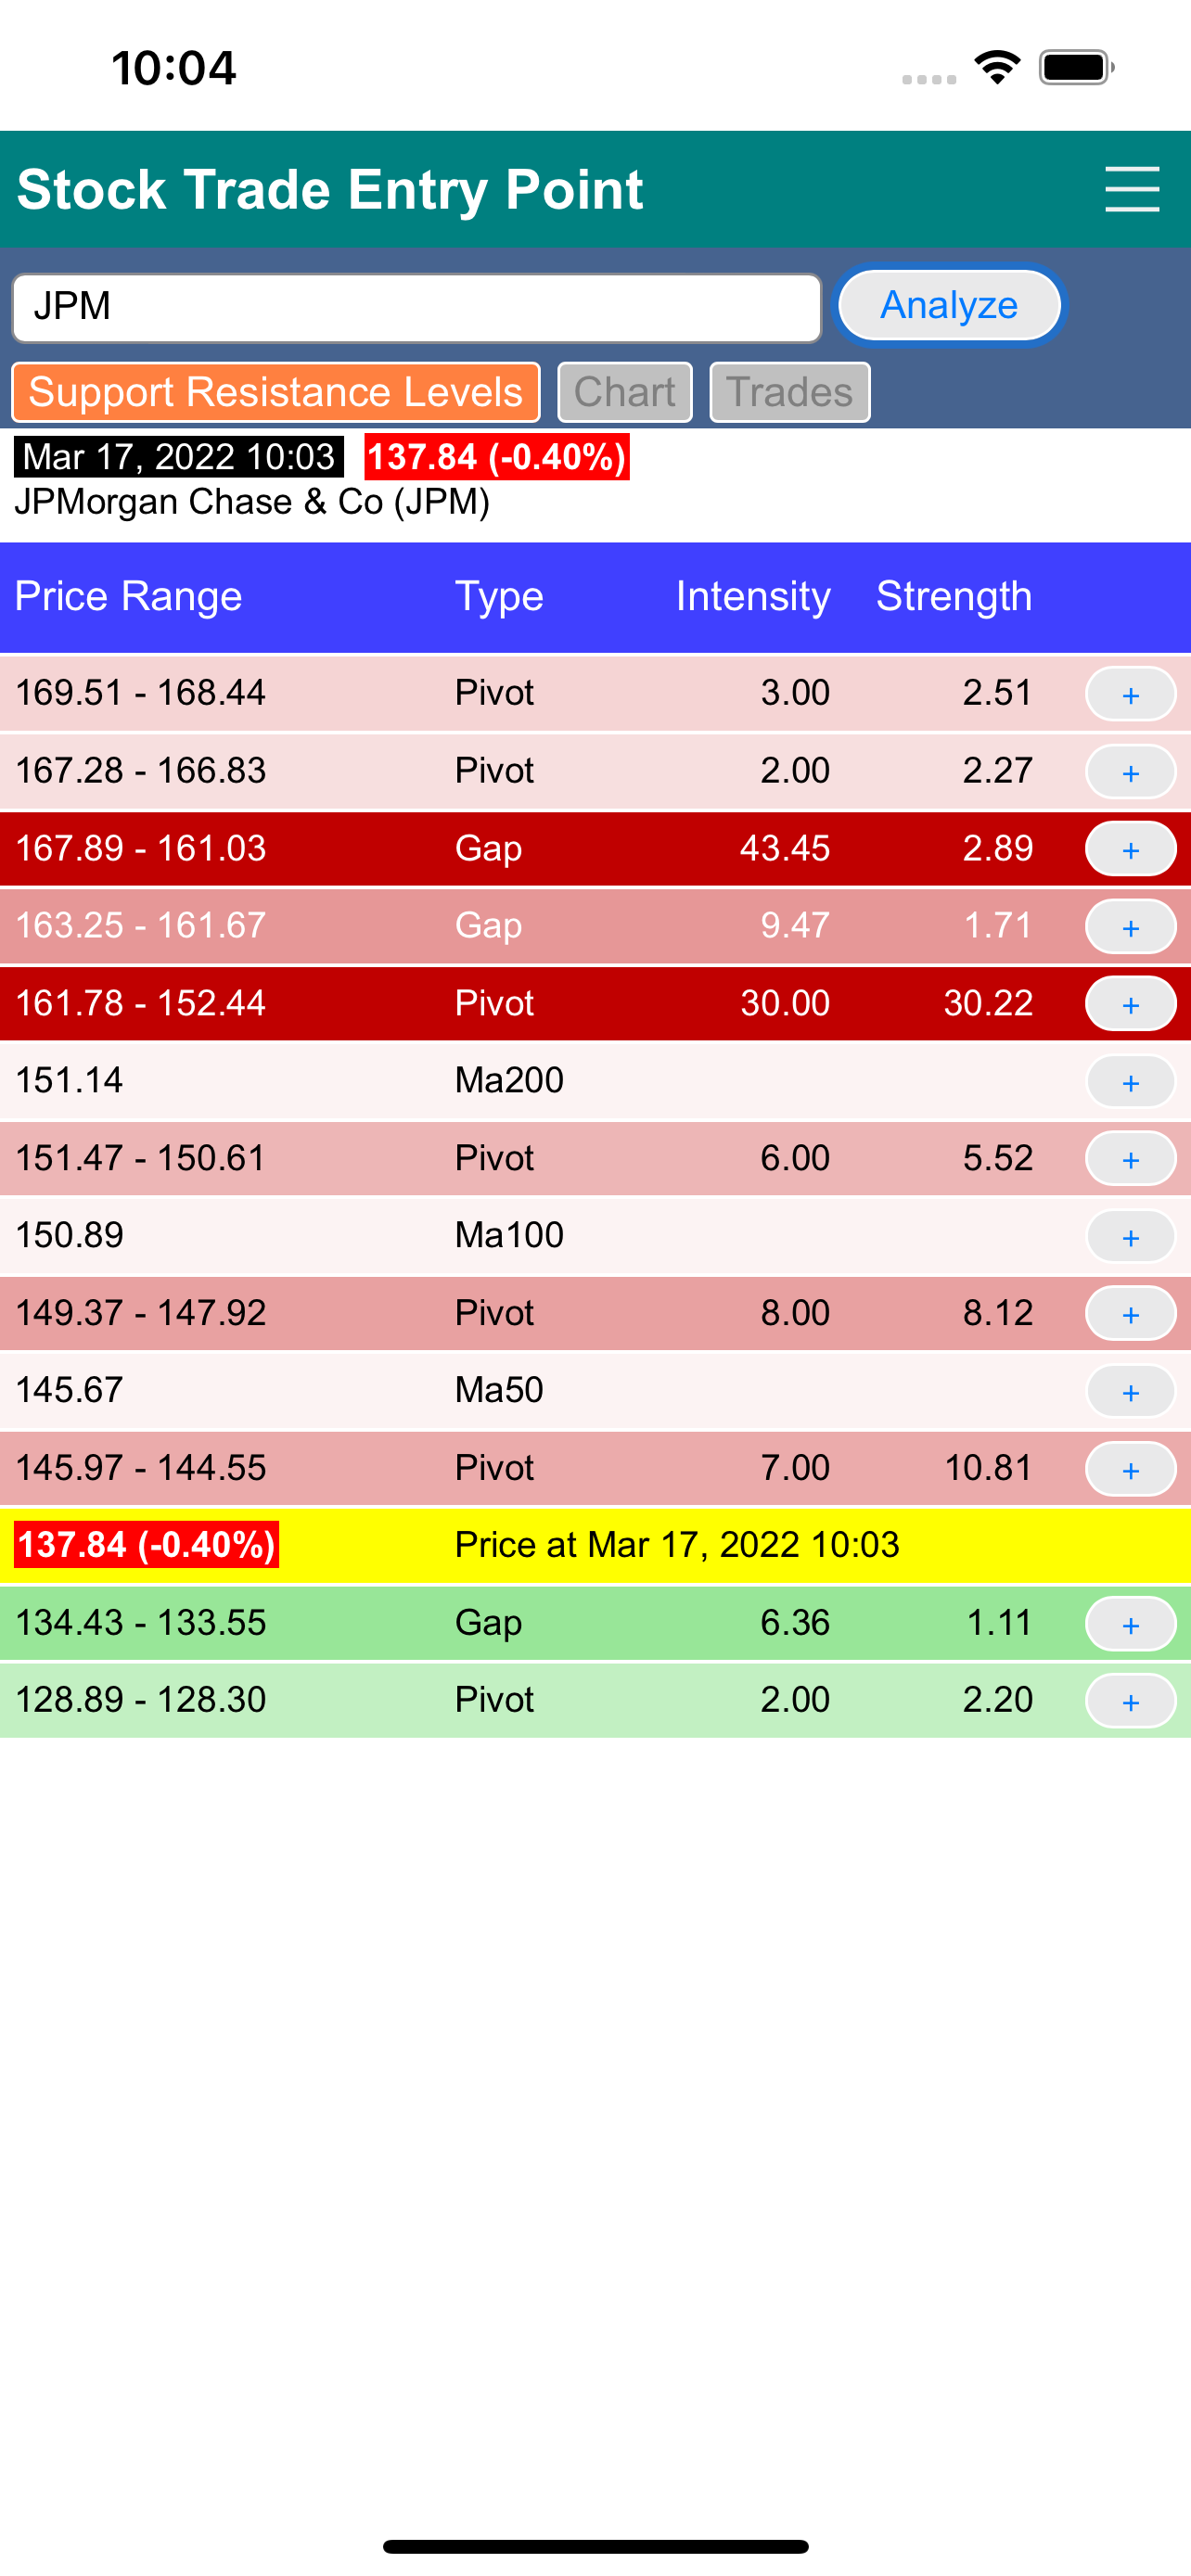
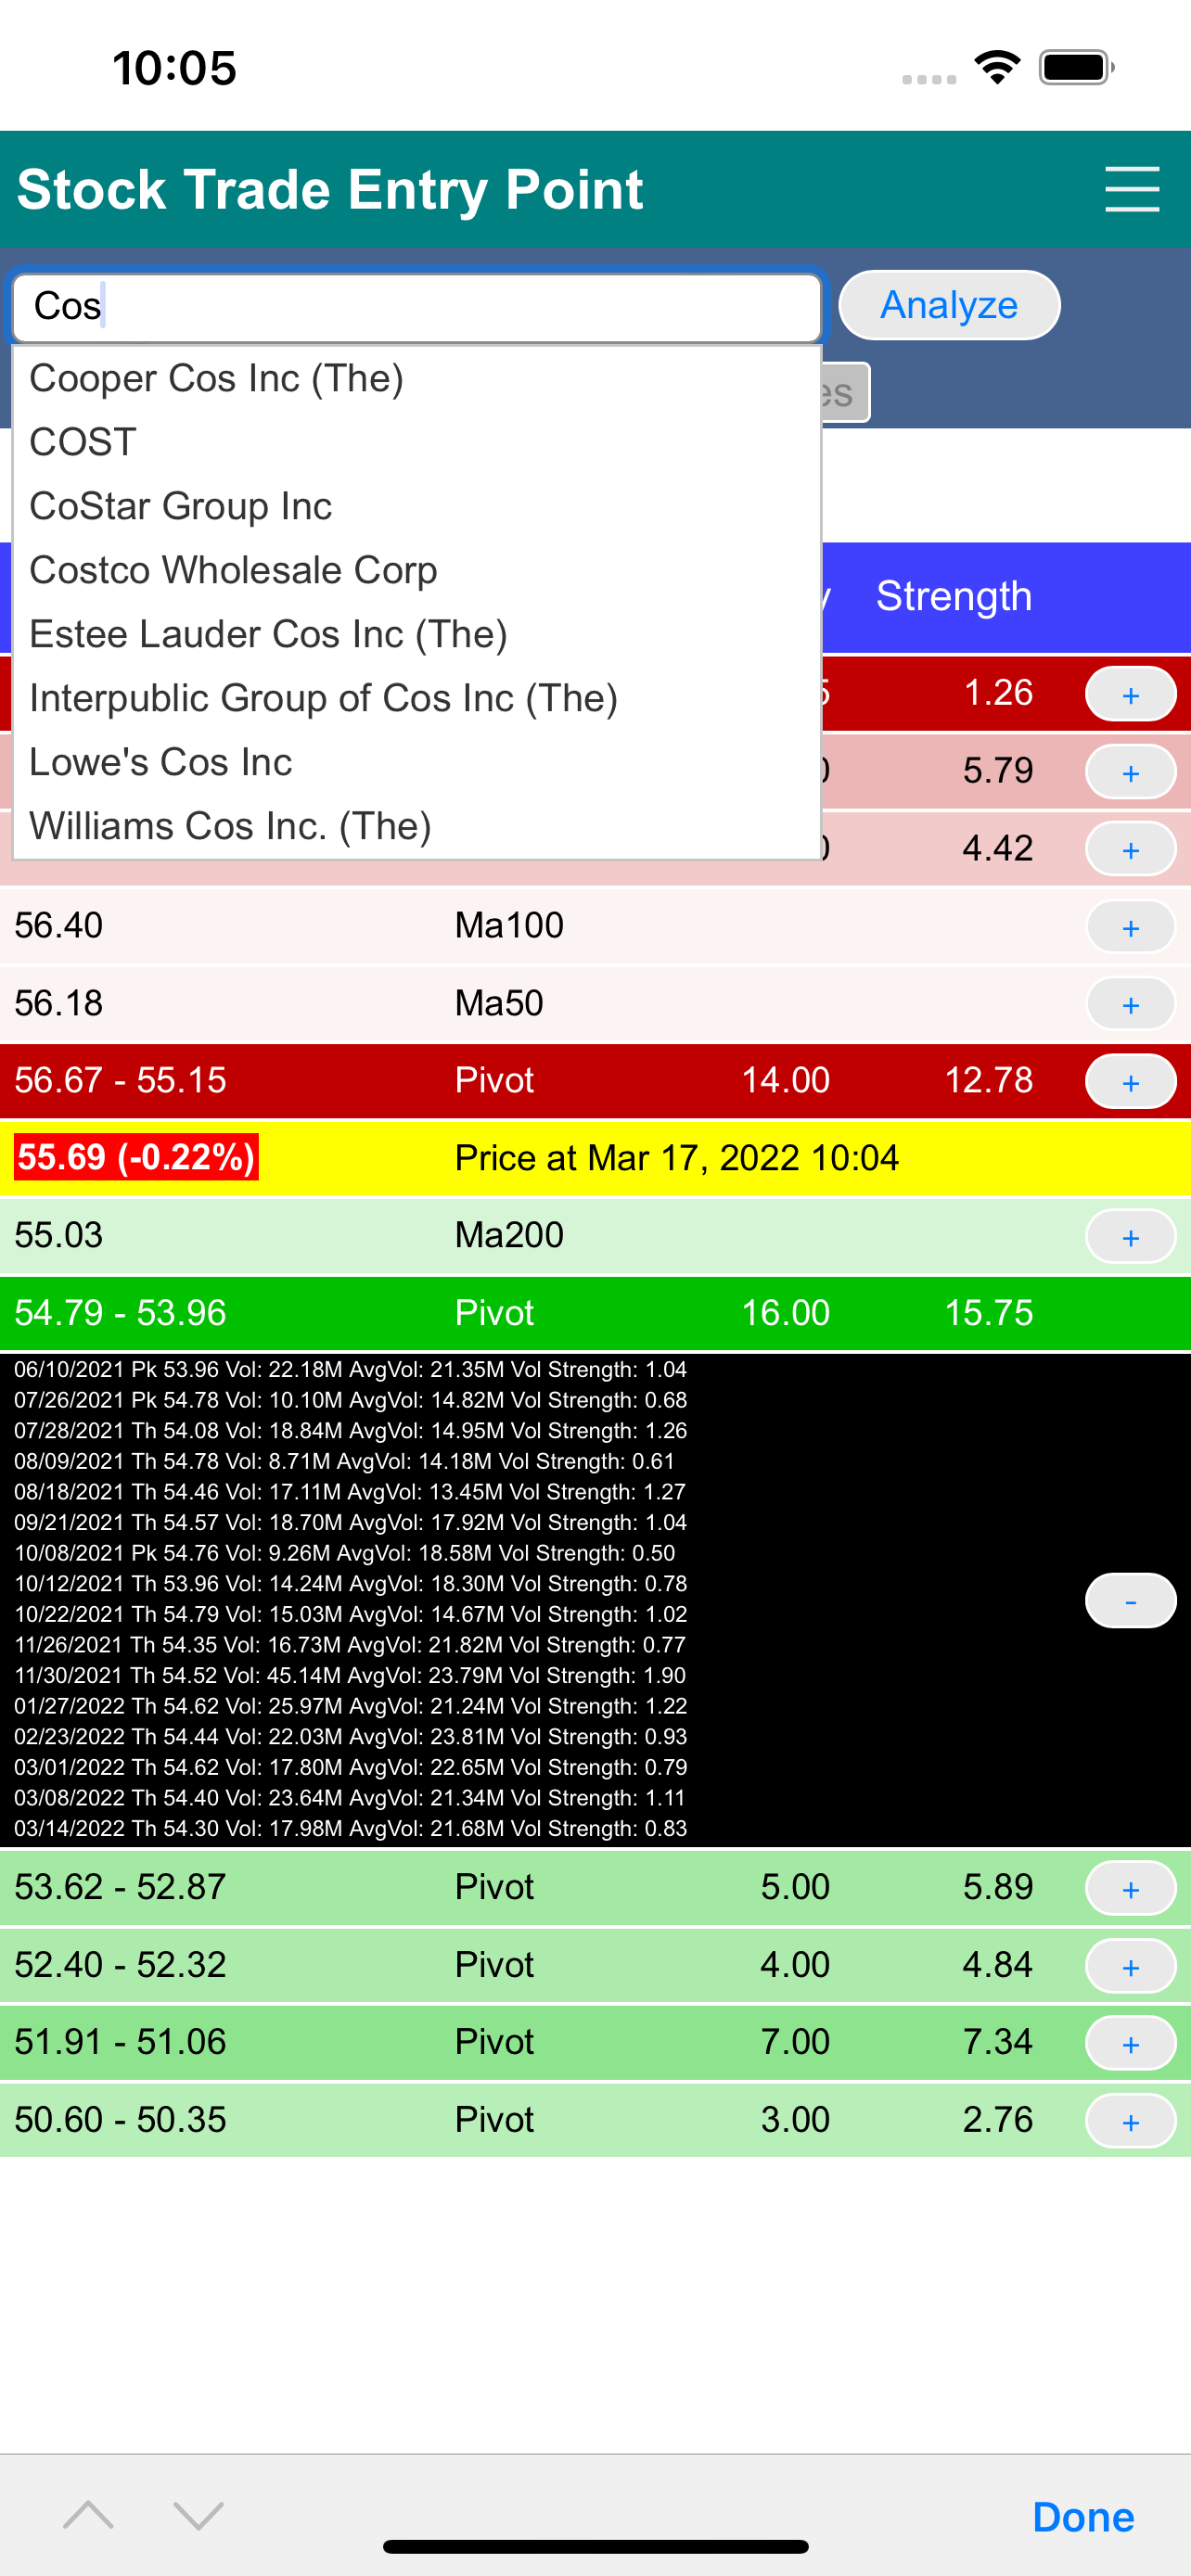
In the Summary screen, support resistance levels are shown with their price ranges, types, intensity and strength. You can also click the “+” (show details) button to bring up the detail view of the level. For the example of a pivot point level, the detail view shows the occurrence of each pivot point instance with its date, price, volume, average volume and volume strength.
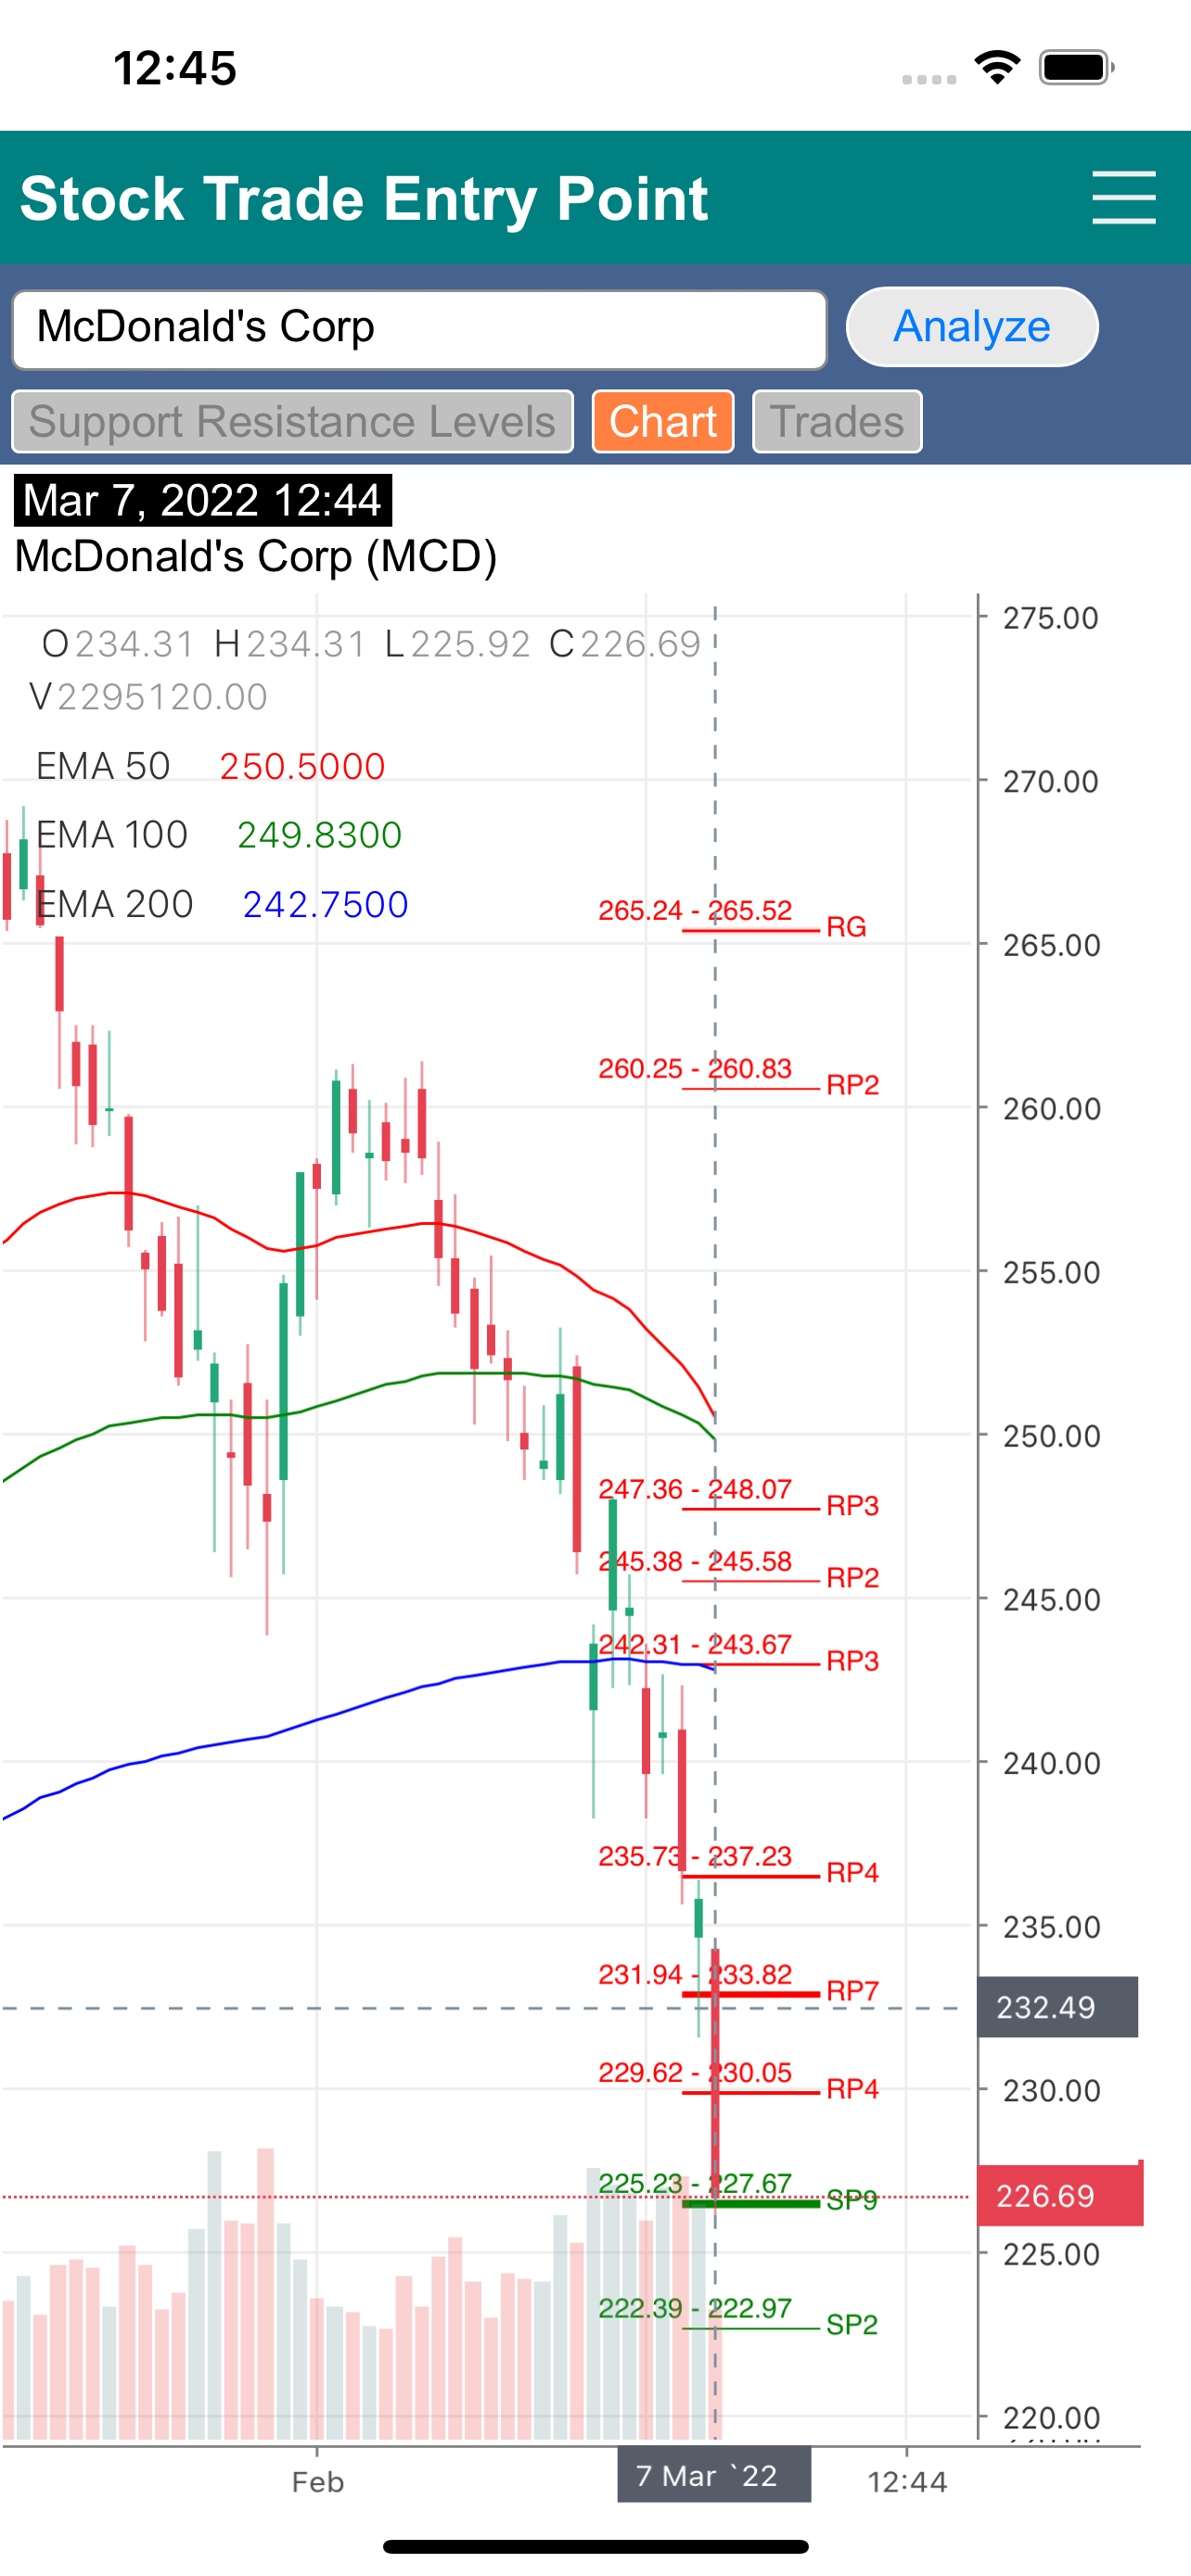
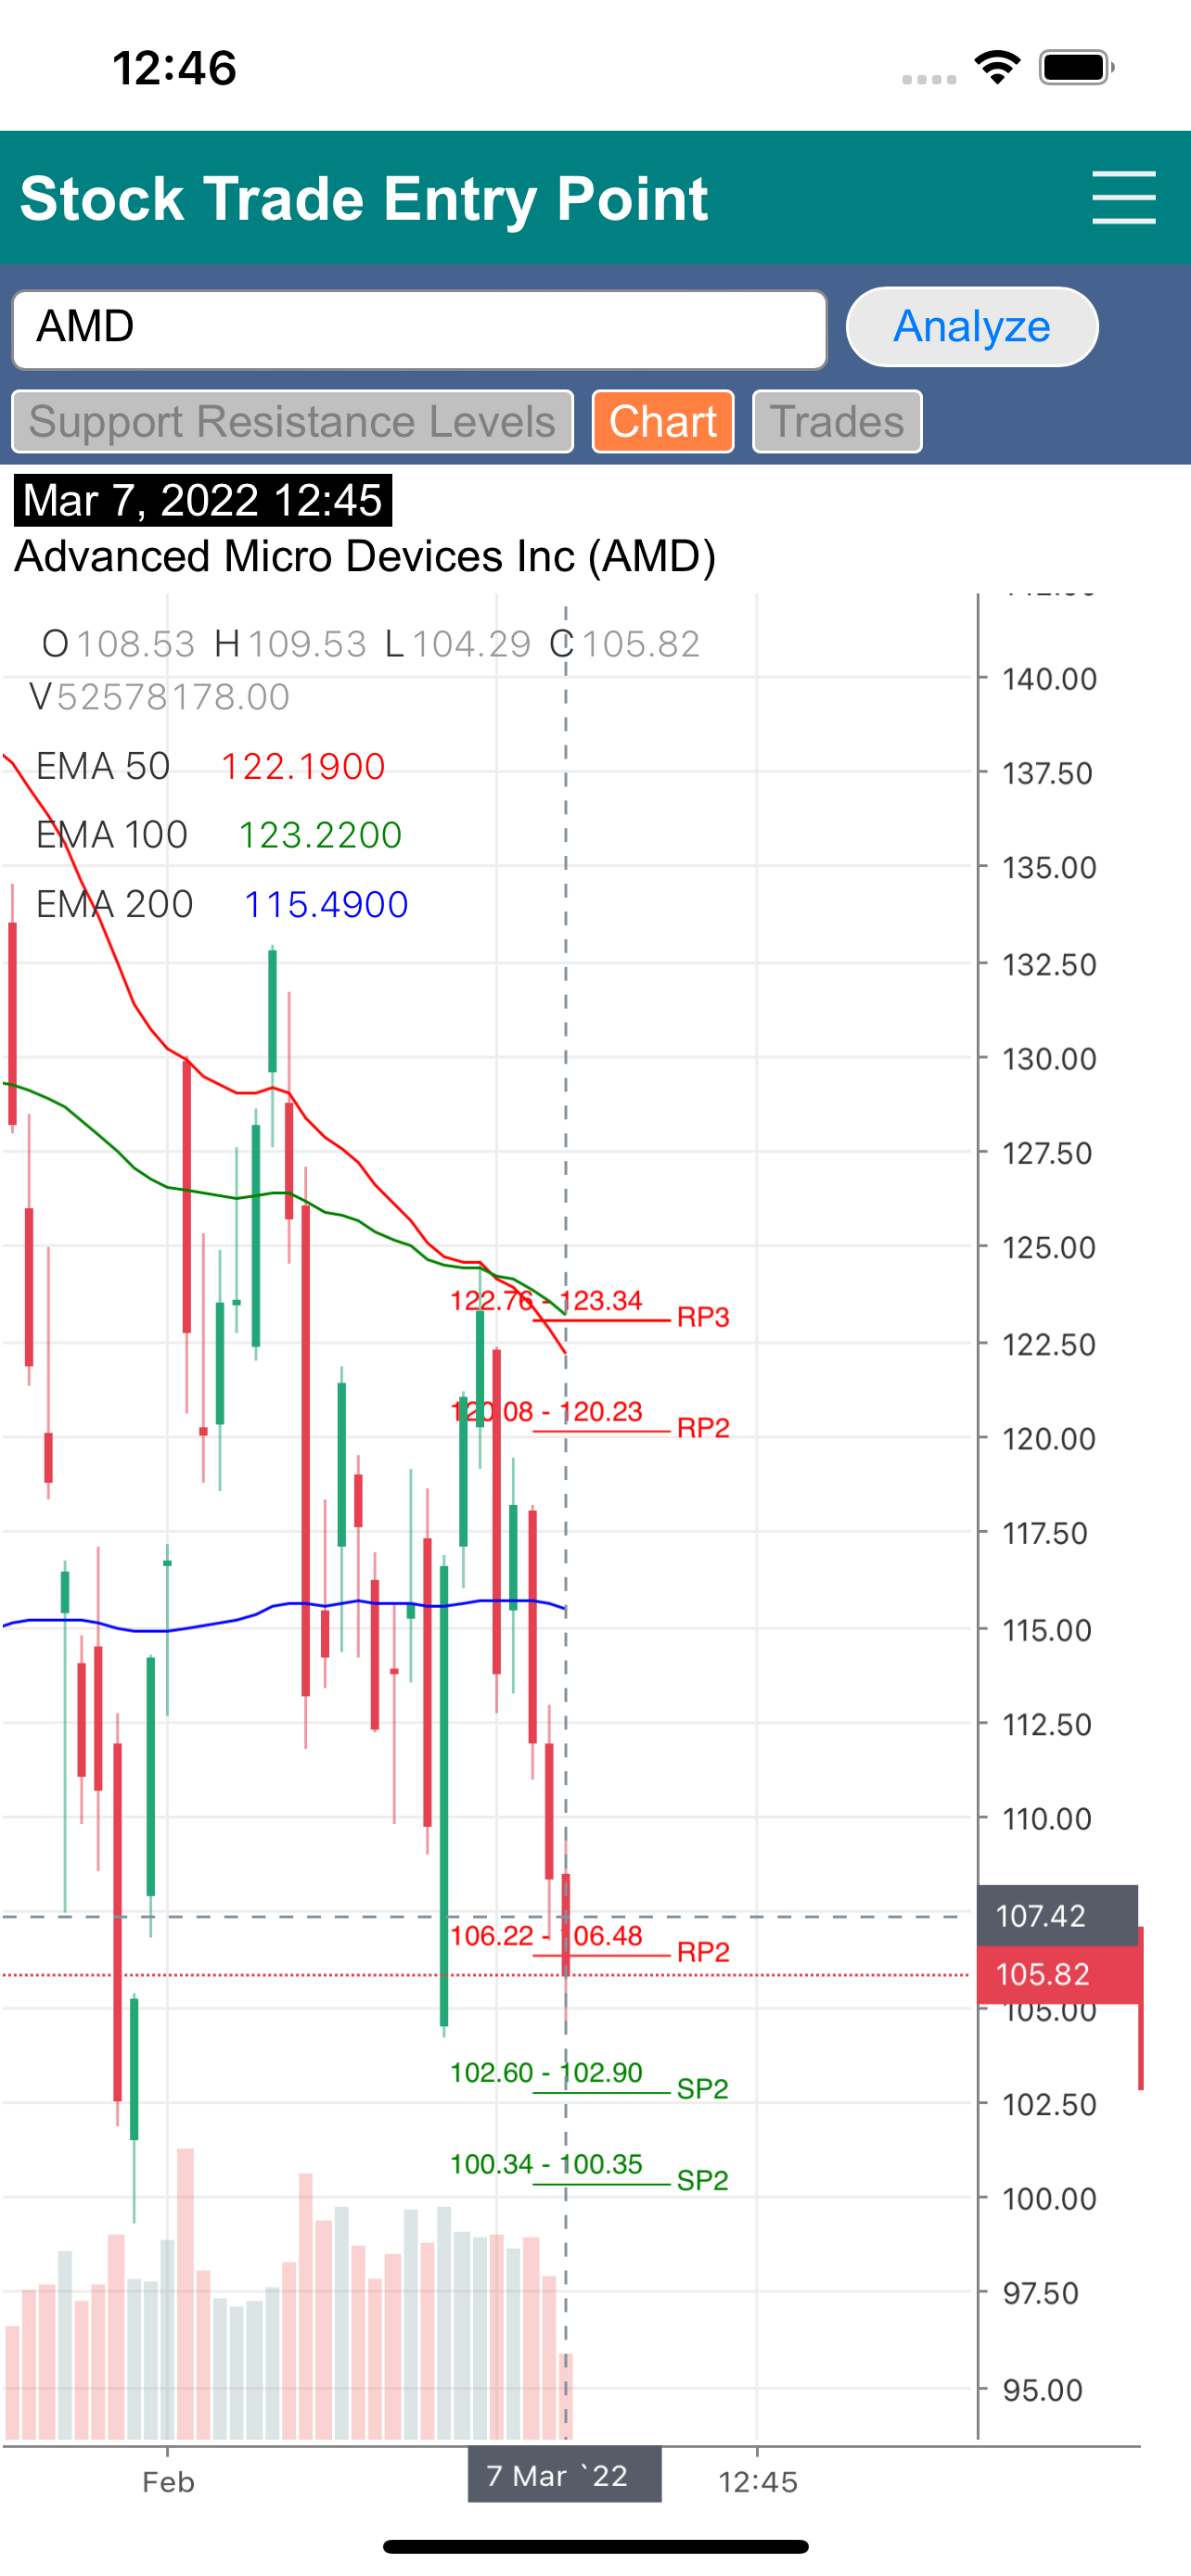
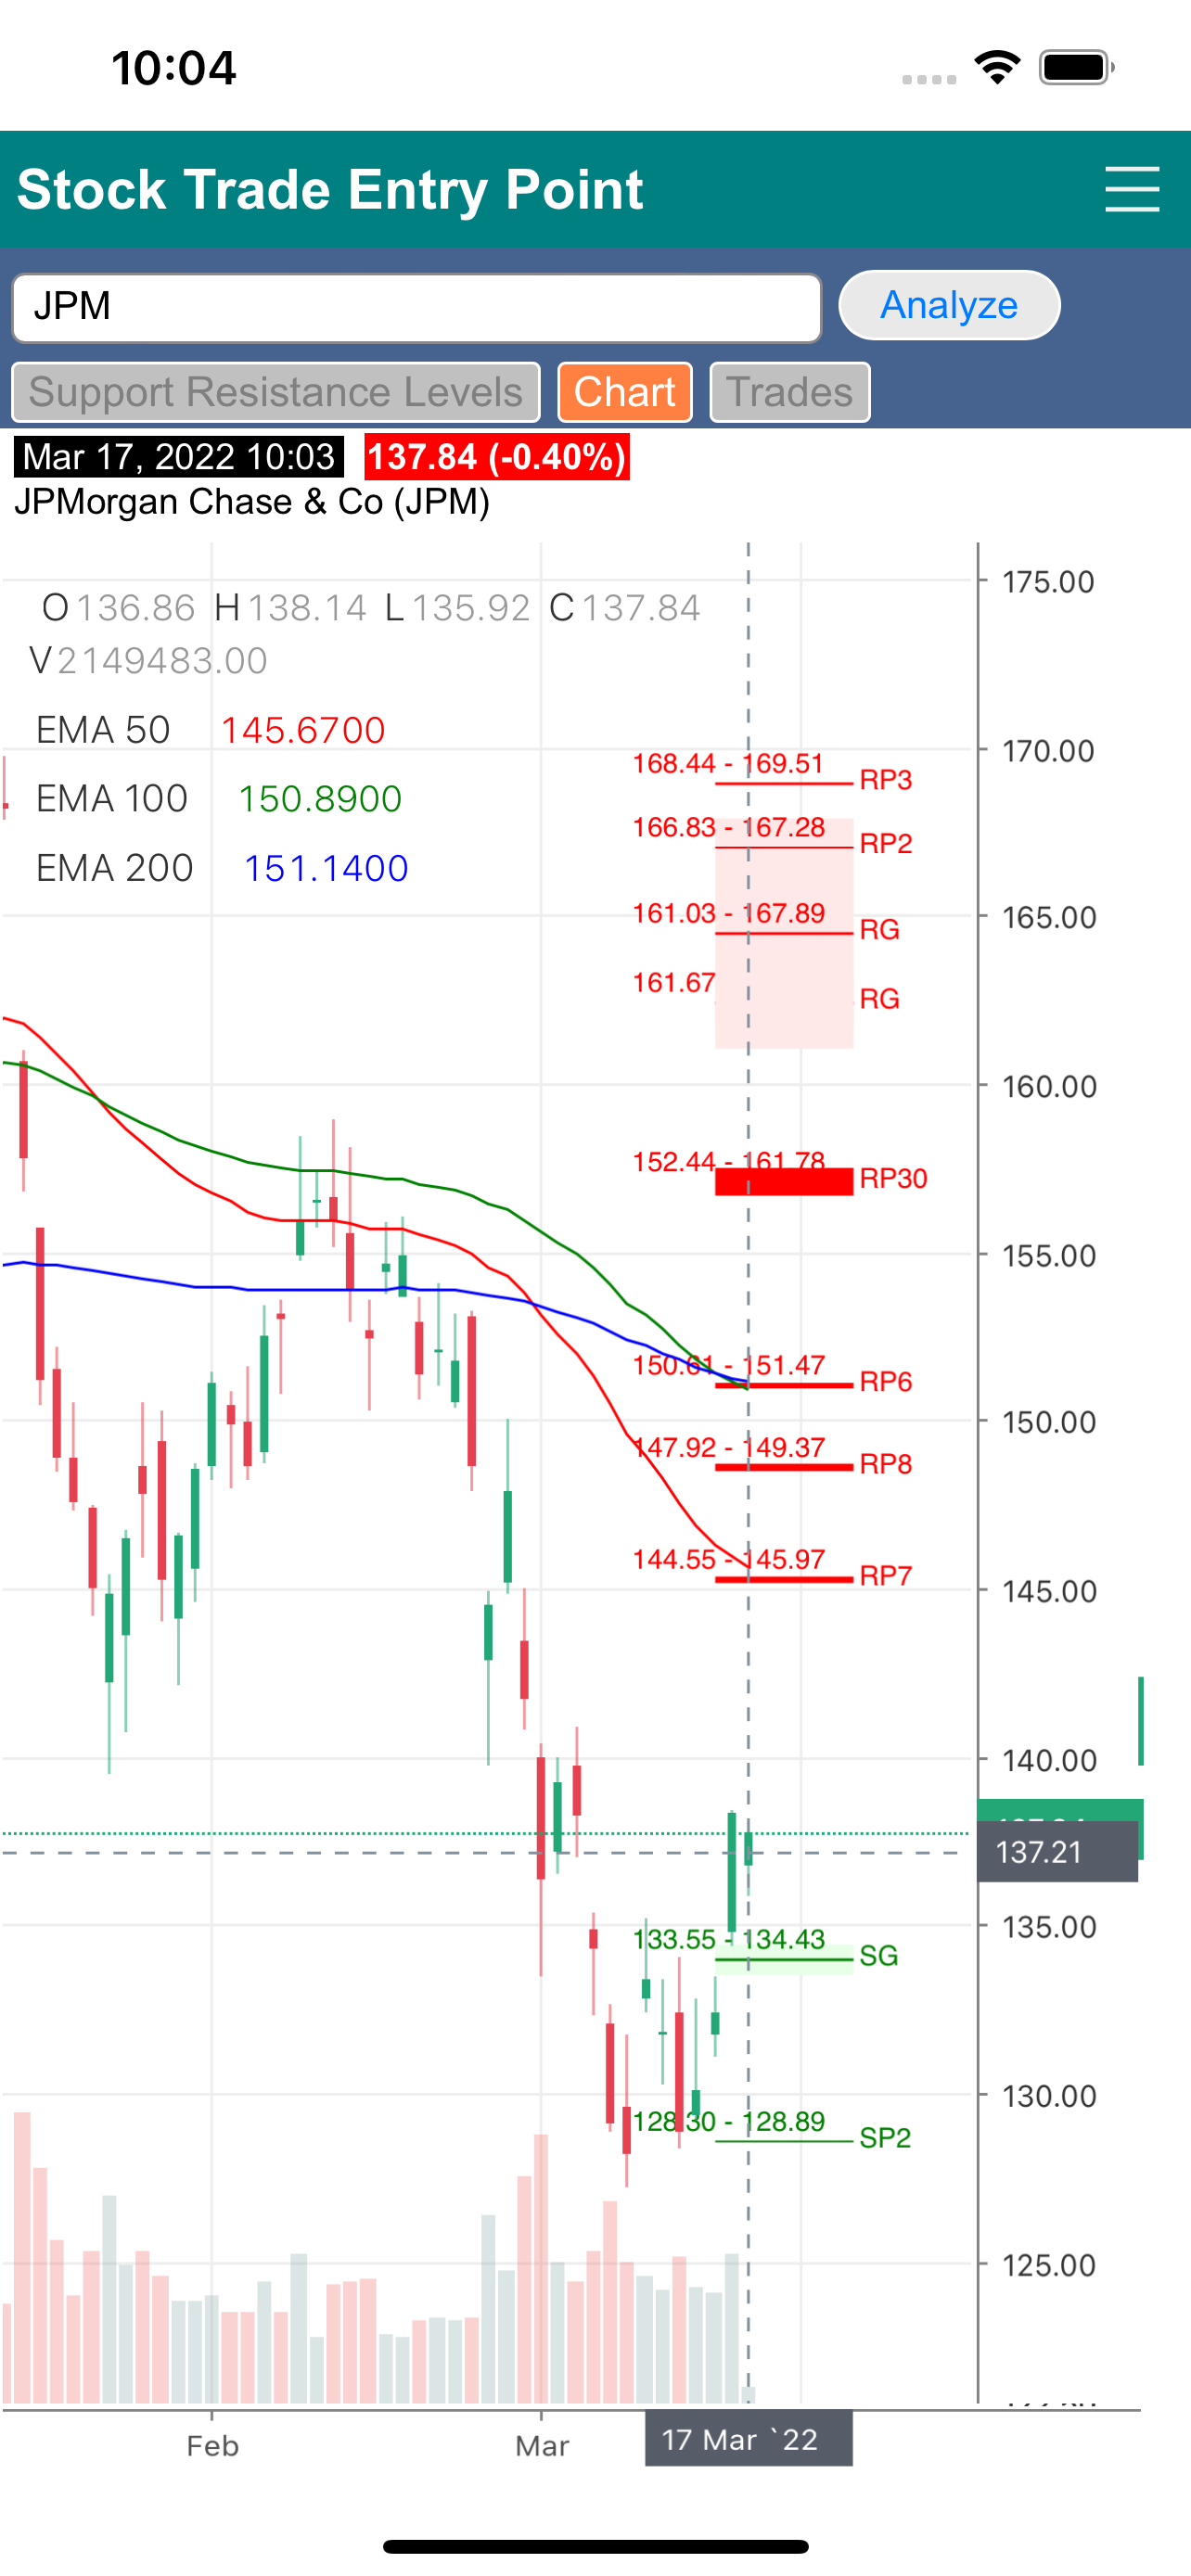
The Chart screen show the candle stick charting of the stock within the analysis date range. The last ticker (current price) is shown with the support resistance levels, gaps and EMAs, which gives a visual representation of where all the prices sit at as well as the strength of the supports and resistances.
Hide
Show More...
The analysis starts with finding support and resistance levels based on pivot points, gaps and major moving averages commonly used by traders. The strength of each support and resistance level is further determined by various characteristics of the levels including number of occurrences, volume strength and number of times they have succeeded or failed with providing support or resistance in the past, etc.
When US market is open, the analysis takes the real time price of the stock (or ETF) in comparison with its support and resistance levels to find suitable trading opportunities. Range bound strategy looks for a large price swing between strong support and resistance levels. Break out strategy looks for opportunities for a price movement to penetrate a resistance level and for the previous resistance level to become support. Break down strategy works similarly to the break out strategy but for the price going in the other direction. There are also cases when the price is going for a ride without any resistance or taking a dive without any support.
Once a suitable trading opportunity is found, the analyzer calculates the entering price with the setup criteria, exit price and cut loss price as well as the gain, maximum losses percentage, and reward-to-risk ratio.
In the Summary screen, support resistance levels are shown with their price ranges, types, intensity and strength. You can also click the “+” (show details) button to bring up the detail view of the level. For the example of a pivot point level, the detail view shows the occurrence of each pivot point instance with its date, price, volume, average volume and volume strength.
The Chart screen show the candle stick charting of the stock within the analysis date range. The last ticker (current price) is shown with the support resistance levels, gaps and EMAs, which gives a visual representation of where all the prices sit at as well as the strength of the supports and resistances.
In-Apps
- App Registration
- $999.00
Screenshots

Stock Trade Entry Point FAQ
-
Is Stock Trade Entry Point free?
Yes, Stock Trade Entry Point is free to download, however it contains in-app purchases or subscription offerings.
-
Is Stock Trade Entry Point legit?
Not enough reviews to make a reliable assessment. The app needs more user feedback.
Thanks for the vote -
How much does Stock Trade Entry Point cost?
Stock Trade Entry Point has several in-app purchases/subscriptions, the average in-app price is $999.00.
-
What is Stock Trade Entry Point revenue?
To get estimated revenue of Stock Trade Entry Point app and other AppStore insights you can sign up to AppTail Mobile Analytics Platform.

User Rating
App is not rated in Mexico yet.
Ratings History
Stock Trade Entry Point Reviews
Store Rankings
Ranking History
App Ranking History not available yet
Category Rankings
App is not ranked yet
Stock Trade Entry Point Competitors
Stock Trade Entry Point Installs
Last 30 days
Stock Trade Entry Point Revenue
Last 30 daysStock Trade Entry Point Revenue and Downloads
Gain valuable insights into Stock Trade Entry Point performance with our analytics.
Sign up now to access downloads, revenue, and more.
Sign up now to access downloads, revenue, and more.
App Info
- Category
- Finance
- Publisher
- George Kung
- Languages
- English
- Recent release
- 1.1.1 (3 years ago )
- Released on
- Mar 7, 2022 (3 years ago )
- Also available in
- United States, United Kingdom, Argentina, Austria, Australia, Azerbaijan, Belgium, Bulgaria, Bahrain, Brunei, Brazil, Belarus, Canada, Switzerland, Chile, China, Colombia, Cyprus, Czechia, Germany, Denmark, Dominican Republic, Algeria, Ecuador, Egypt, Spain, Finland, France, Greece, Hong Kong SAR China, Croatia, Hungary, Indonesia, Ireland, Israel, India, Iceland, Italy, Japan, South Korea, Kuwait, Kazakhstan, Lebanon, Sri Lanka, Lithuania, Luxembourg, Latvia, Madagascar, Malta, Mexico, Malaysia, Nigeria, Netherlands, Norway, Nepal, New Zealand, Peru, Philippines, Pakistan, Poland, Portugal, Romania, Russia, Saudi Arabia, Sweden, Singapore, Slovenia, Slovakia, Thailand, Tunisia, Türkiye, Taiwan, Ukraine, Vietnam, Uzbekistan, South Africa, United Arab Emirates
- Last Updated
- 6 months ago
This page includes copyrighted content from third parties, shared solely for commentary and research in accordance with fair use under applicable copyright laws. All trademarks, including product, service, and company names or logos, remain the property of their respective owners. Their use here falls under nominative fair use as outlined by trademark laws and does not suggest any affiliation with or endorsement by the trademark holders.