App is temporarily unavailable

Description
V-Graph Save is a scientific graphing calculator for iPhone and iPad that is designed to solve real problems in engineering and science.
(V-Solve is a free app that has all of the features of V-Graph Save except for graphing and being able to save equations to the library. V-Solve has a demo feature which shows the graphing features of V-Graph Save for a select set of equations.)
Overview of Features
• Solves and plots explicit and implicit equations.
• Equations are entered and displayed in their natural form, as they would appear in a textbook.
• 59 categories of units in library, divided into english, metric, and SI systems.
• Equations, constants, and user-defined unit conversions can be saved into libraries.
• Well-organized Main, Trigonometric, English, and Greek keypads.
• Help screen overlay provides pop-up description of the function of key buttons.
• Tutorials provide demonstration of the calculator's capabilities by programmatically stepping through graphing, equation creation and saving to the library, and unit conversion examples.
Graphing
• Plots explicit and implicit equations.
• Up to 3 equations can be plotted simultaneously.
• Pinch and Pan capabilities.
• Linear, log, inverse, inverse for celsius, inverse for fahrenheit scales for both x and y axes.
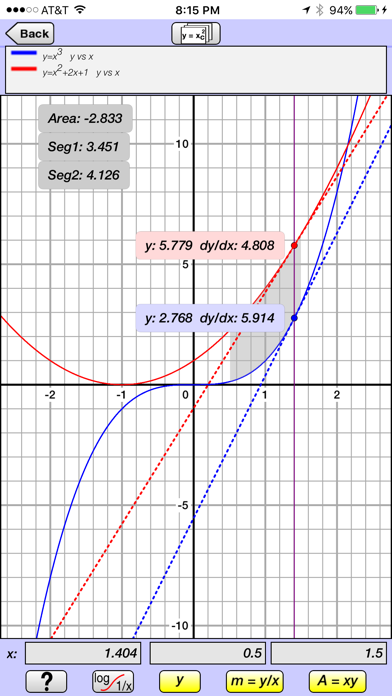
• Cursor displays both the y-value and slope for each equation.
• Cursor can be controlled by a finger or by entering an exact x-value.
• Area under the curve and line segment length can be displayed for a specified x-value range for one equation.
• For two equations, the area between the curves and the line segment length for both curves are displayed.
Equation Creation and Display
• Equations are created and displayed in their natural form, as they would appear in a textbook.
• Number Mode allows equations based on y (dependent variable) and x (independent variable) to be quickly created, solved, plotted, and have unit conversions carried out on the dependent variable.
• Variable Mode allows equations with more complex variables to be created and saved to the equation library under user-defined categories.
• Up to 3 equations from the library can be plotted simultaneously.
• Super- and sub-scripting of variables.
• Functions include square root, squared, x to any power, log, ln, 10 to any power, e to any power, factorial, trigonometric (including inverse), hyperbolic (including inverse).
• Button selector allows the variable symbol or its value to be displayed in the equation.
• Previously used equations are maintained in memory and can be easily accessed.
Unit Conversions
• Unit conversions are made simultaneously, and are displayed as a table of all units of the same category.
• New units can be created and saved to the library, using the base units (m, s, g, ft, lb, etc).
• New units are easily created using picker dials for the metric prefix (k, M, G, etc), base units, and power of 1, 2, 3, etc.
Equation and Constant Libraries
• Equation library with categories of Algebra, Geometry, Physical Properties (Vapor Pressure), Heat Transfer, Statistics, and Electricity.
• Physics constant library.
• New Equations and Constants can be saved to libraries under user-defined categories.
• Equation library has a summary page for each equation, which includes a display of the equation, its variables in table format, and a detailed description.
Other Features
• E-mail contact.
• Memory stack maintains values, variable symbols, and equation names of an unlimited number of previous calculations.
• Multiple answers for implicit equations are saved to the memory stack.
• Period or comma can be used as decimal separator.
• Degrees or radians for trigonometric functions.
• Decimal or Scientific Notation, and number of significant digits can be easily specified.
• Convergence criteria and maximum number of iterations can be specified for implicit equations.
Hide
Show More...
(V-Solve is a free app that has all of the features of V-Graph Save except for graphing and being able to save equations to the library. V-Solve has a demo feature which shows the graphing features of V-Graph Save for a select set of equations.)
Overview of Features
• Solves and plots explicit and implicit equations.
• Equations are entered and displayed in their natural form, as they would appear in a textbook.
• 59 categories of units in library, divided into english, metric, and SI systems.
• Equations, constants, and user-defined unit conversions can be saved into libraries.
• Well-organized Main, Trigonometric, English, and Greek keypads.
• Help screen overlay provides pop-up description of the function of key buttons.
• Tutorials provide demonstration of the calculator's capabilities by programmatically stepping through graphing, equation creation and saving to the library, and unit conversion examples.
Graphing
• Plots explicit and implicit equations.
• Up to 3 equations can be plotted simultaneously.
• Pinch and Pan capabilities.
• Linear, log, inverse, inverse for celsius, inverse for fahrenheit scales for both x and y axes.
• Cursor displays both the y-value and slope for each equation.
• Cursor can be controlled by a finger or by entering an exact x-value.
• Area under the curve and line segment length can be displayed for a specified x-value range for one equation.
• For two equations, the area between the curves and the line segment length for both curves are displayed.
Equation Creation and Display
• Equations are created and displayed in their natural form, as they would appear in a textbook.
• Number Mode allows equations based on y (dependent variable) and x (independent variable) to be quickly created, solved, plotted, and have unit conversions carried out on the dependent variable.
• Variable Mode allows equations with more complex variables to be created and saved to the equation library under user-defined categories.
• Up to 3 equations from the library can be plotted simultaneously.
• Super- and sub-scripting of variables.
• Functions include square root, squared, x to any power, log, ln, 10 to any power, e to any power, factorial, trigonometric (including inverse), hyperbolic (including inverse).
• Button selector allows the variable symbol or its value to be displayed in the equation.
• Previously used equations are maintained in memory and can be easily accessed.
Unit Conversions
• Unit conversions are made simultaneously, and are displayed as a table of all units of the same category.
• New units can be created and saved to the library, using the base units (m, s, g, ft, lb, etc).
• New units are easily created using picker dials for the metric prefix (k, M, G, etc), base units, and power of 1, 2, 3, etc.
Equation and Constant Libraries
• Equation library with categories of Algebra, Geometry, Physical Properties (Vapor Pressure), Heat Transfer, Statistics, and Electricity.
• Physics constant library.
• New Equations and Constants can be saved to libraries under user-defined categories.
• Equation library has a summary page for each equation, which includes a display of the equation, its variables in table format, and a detailed description.
Other Features
• E-mail contact.
• Memory stack maintains values, variable symbols, and equation names of an unlimited number of previous calculations.
• Multiple answers for implicit equations are saved to the memory stack.
• Period or comma can be used as decimal separator.
• Degrees or radians for trigonometric functions.
• Decimal or Scientific Notation, and number of significant digits can be easily specified.
• Convergence criteria and maximum number of iterations can be specified for implicit equations.
Screenshots
V-Graph Save FAQ
-
Is V-Graph Save free?
V-Graph Save is not free (it costs 17900.00), however it doesn't contain in-app purchases or subscriptions.
-
Is V-Graph Save legit?
Not enough reviews to make a reliable assessment. The app needs more user feedback.
Thanks for the vote -
How much does V-Graph Save cost?
The price of V-Graph Save is 17900.00.
-
What is V-Graph Save revenue?
To get estimated revenue of V-Graph Save app and other AppStore insights you can sign up to AppTail Mobile Analytics Platform.

User Rating
App is not rated in Colombia yet.

Ratings History
V-Graph Save Reviews
V-Graph Save Installs
Last 30 daysV-Graph Save Revenue
Last 30 daysV-Graph Save Revenue and Downloads
Gain valuable insights into V-Graph Save performance with our analytics.
Sign up now to access downloads, revenue, and more.
Sign up now to access downloads, revenue, and more.
This page includes copyrighted content from third parties, shared solely for commentary and research in accordance with fair use under applicable copyright laws. All trademarks, including product, service, and company names or logos, remain the property of their respective owners. Their use here falls under nominative fair use as outlined by trademark laws and does not suggest any affiliation with or endorsement by the trademark holders.


