IOS, yes. Android,?
It seems to work fine with my iPhone, but my android tablet struggles mightily with it. Maybe the Lenovo is the “no go” part.

Yes, Vernier Graphical Analysis is completely free and it doesn't have any in-app purchases or subscriptions.
⚠️ The Vernier Graphical Analysis app has poor ratings and negative feedback. Users seem unsatisfied with its performance or features.
Vernier Graphical Analysis is free.
To get estimated revenue of Vernier Graphical Analysis app and other AppStore insights you can sign up to AppTail Mobile Analytics Platform.

3.93 out of 5
15 ratings in China
It seems to work fine with my iPhone, but my android tablet struggles mightily with it. Maybe the Lenovo is the “no go” part.
This app, when I started using it, opened up a vortex and sucked me in. I came out of the vortex 3 months later in a large California mansion as a large, beefy, muscular millionaire man. This app changed me. It brought me love, and victory. If you’re in some highschool class like I was, beware, because this may change your life forever.
As I walked to class one winter evening, I remembered my physics teacher signed we must download a new app, then I did. As I downloaded this app I help a burden lifted off my chest. NOW I CAN HEAR! I scream and shouted, but my classmates didn’t hear me (because were just as dead as I just was). here is why I am giving this a 1 star. As I opened the app, a video of 2 masked men came on the screen, they said if I were to ever delete the app, they will personally permanently remove my eardrums. I deleted the app to see it they were lying but they weren’t, I AM ANGRY! I want my eardrums back
I EAT GYATTS I EAT GYATTS I EAT GYATTS I EAT GYATTS I EAT GYATTS I EAT GYATTS I EAT GYATTS I EAT GYATTS I EAT GYATTS I EAT GYATTS I EAT GYATTS I EAT GYATTS I EAT GYATTS I EAT GYATTS I EAT GYATTS I EAT GYATTS I EAT GYATTS I EAT GYATTS I EAT GYATTS I EAT GYATTS I EAT GYATTS I EAT GYATTS I EAT GYATTS I EAT GYATTS I EAT GYATTS I EAT GYATTS I EAT GYATTS I EAT GYATTS I EAT GYATTS I EAT GYATTS I EAT GYATTS I EAT GYATTS I EAT GYATTS I EAT GYATTS I EAT GYATTS I EAT GYATTS I EAT GYATTS I EAT GYATTS I EAT GYATTS I EAT GYATTS I EAT GYATTS I EAT GYATTS I EAT GYATTS I EAT GYATTS I EAT GYATTS I EAT GYATTS I EAT GYATTS I EAT GYATTS I EAT GYATTS I EAT GYATTS I EAT GYATTS I EAT GYATTS I EAT GYATTS I EAT GYATTS I EAT GYATTS I EAT GYATTS I EAT GYATTS I EAT GYATTS I EAT GYATTS I EAT GYATTS I EAT GYATTS I EAT GYATTS I EAT GYATTS I EAT GYATTS I EAT GYATTS I EAT GYATTS I EAT GYATTS I EAT GYATTS I EAT GYATTS I EAT GYATTS I EAT GYATTS I EAT GYATTS I EAT GYATTS I EAT GYATTS I EAT GYATTS I EAT GYATTS I EAT GYATTS I EAT GYATTS I EAT GYATTS I EAT GYATTS I EAT GYATTS I EAT GYATTS I EAT GYATTS I EAT GYATTS I EAT GYATTS I EAT GYATTS I EAT GYATTS I EAT GYATTS I EAT GYATTS I EAT GYATTS I EAT GYATTS I EAT GYATTS I EAT GYATTS I EAT GYATTS I EAT GYATTS I EAT GYATTS
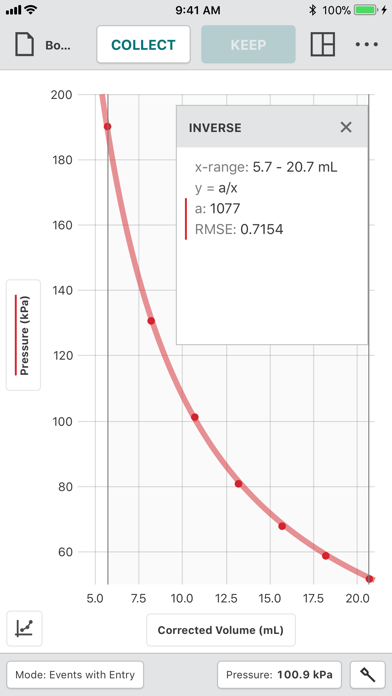
I got this app for chemistry class. As I connected to Bluetooth I have never been the same!
All I wanted was some boba while doing my AP chem lab. Instead this app tackled me to the ground and cuffed me telling me I had the right to remain silent and anything I said would be used against me in the court of law. Overall a mid app and would not recommend unless you dont like boba and want to go to jail
My life was normal until my teacher made me download this app. It was normal until I activated the Bluetooth in the app. All of a sudden I was attacked with a very bright light and I became semi blind. The only things I can see now are graphs. Runaway while you still can
don’t accept the bluetooth request. now the other side of my brain moves my arm without me consciously knowing it. it’s affecting my daily life i almost strangled myself.
Download this for a biology lab and was immediately flung into a world of vivid colors that blinded my soul before being dragged into a blank unknown world where my mind begged release from. I sit here now in this pit of darkness wondering if my life in this void it was worth the app… 11/10 would highly recommend
I was working normally with this app, then i suddenly turned on the bluetooth i was suddenly transferred to the fifth dimension where i saw figures resembling gods, my brain has fallen into unconscious several tomes due to the loads of information transferred into my cerebral cortex.
|
Chart
|
Category
|
Rank
|
|---|---|---|
|
Top Free
|

|
118
|
|
Top Free
|

|
181
|
|
Top Free
|

|
272
|
|
Top Free
|

|
309
|
|
Top Free
|

|
442
|
| Name | Downloads (30d) | Monthly Revenue | Reviews | Ratings | Recent release | |
|---|---|---|---|---|---|---|

iClicker Student
Formerly iClicker Reef
|
Unlock
|
Unlock
|
4
|
1
|
2 months ago | |

Pearson+ | Study help & eTexts
eTexts, Videos and Practice
|
Unlock
|
Unlock
|
1
|
13
|
1 week ago | |

Gradescope
Assessment Anywhere
|
Unlock
|
Unlock
|
0
|
|
2 months ago | |

Aktiv Learning
Chemistry & Math
|
Unlock
|
Unlock
|
0
|
|
1 month ago | |

SPARKvue
|
Unlock
|
Unlock
|
1
|
|
2 weeks ago | |

Scoir
The College Admissions Network
|
Unlock
|
Unlock
|
0
|
|
1 day ago | |

Arizona State University
|
Unlock
|
Unlock
|
3
|
|
1 month ago | |

Classkick
|
Unlock
|
Unlock
|
0
|
|
3 weeks ago | |
LockDown Browser
|
Unlock
|
Unlock
|
12
|
|
1 month ago | |

Bluebook Exams
Easy to Show What You Know
|
Unlock
|
Unlock
|
4
|
|
1 month ago |
