
Beschreibung
You can see the change in the population by the Logistic Map by a line graph and colony size.
You can observe the variation pattern of population variety by changing slightly the initial value.
Logistic Map is not only used in Population Ecology but also considered one of the starting point of Chaos Theory. I developed this app to help people who are studying Population Ecology or Chaos Theory.
*Logistic Map may not necessarily apply to changes in population of actual organisms, because Logistic Map is a model of a simple change of the population.
■What is Logistic Map?
The Logistic Map is the map that is generated from the Logistic Function that has been devised as a variation model of the population of an organism.
It is expressed by the following function.
X(n+1) = a・X(n)・(1-X(n))
In the above equation, the meaning of each symbol is as follows.
・n:Generation (n=1,2,3,...)
・X(n):Value obtained by normalizing the Population of Generation n-th(0≦X(n)≦1)
・a:Value obtained by normalizing the Reproductive Rates(0≦a≦4)
You can calculate the population of the next generation from a population of a certain generation by using this function. In addition, You can predict the variation of the population over the long term by calculating the population of individuals repeatedly in this function.
■Pattern of Logistic Map
Logistic map vary widely depending on the value of "a".
・In case (0≦a≦1) : X(n) converges to 0.
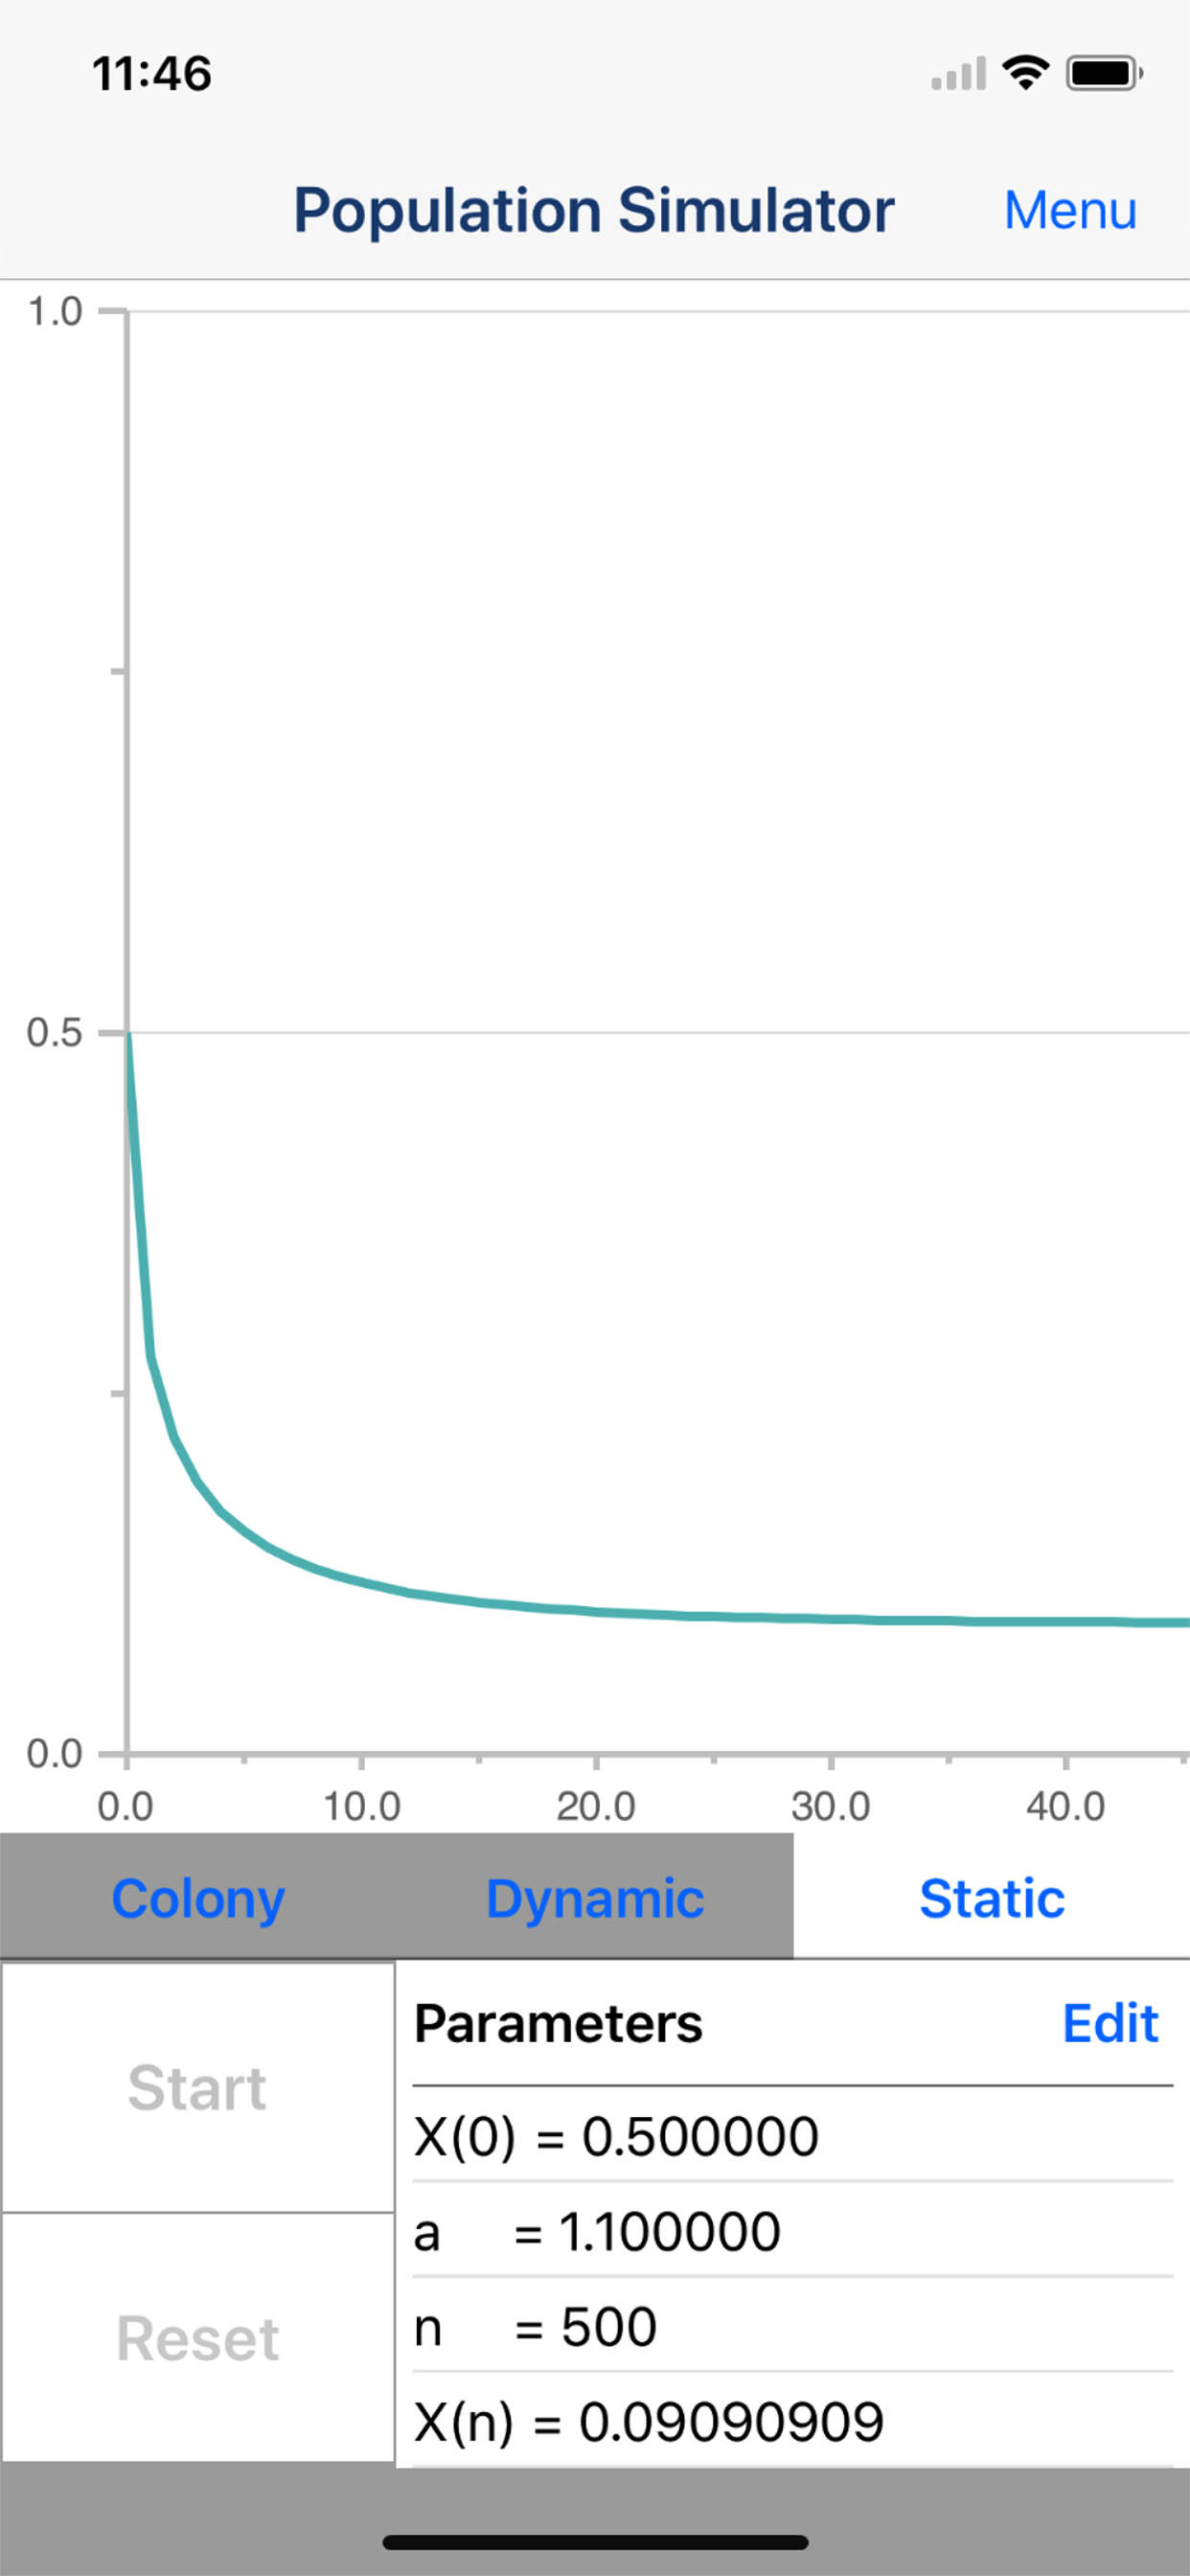
・In case (1<a≦2) : X(n) converges to 1-(1/a).
・In case (2<a≦3) : X(n) converges to 1-(1/a) while oscillating.
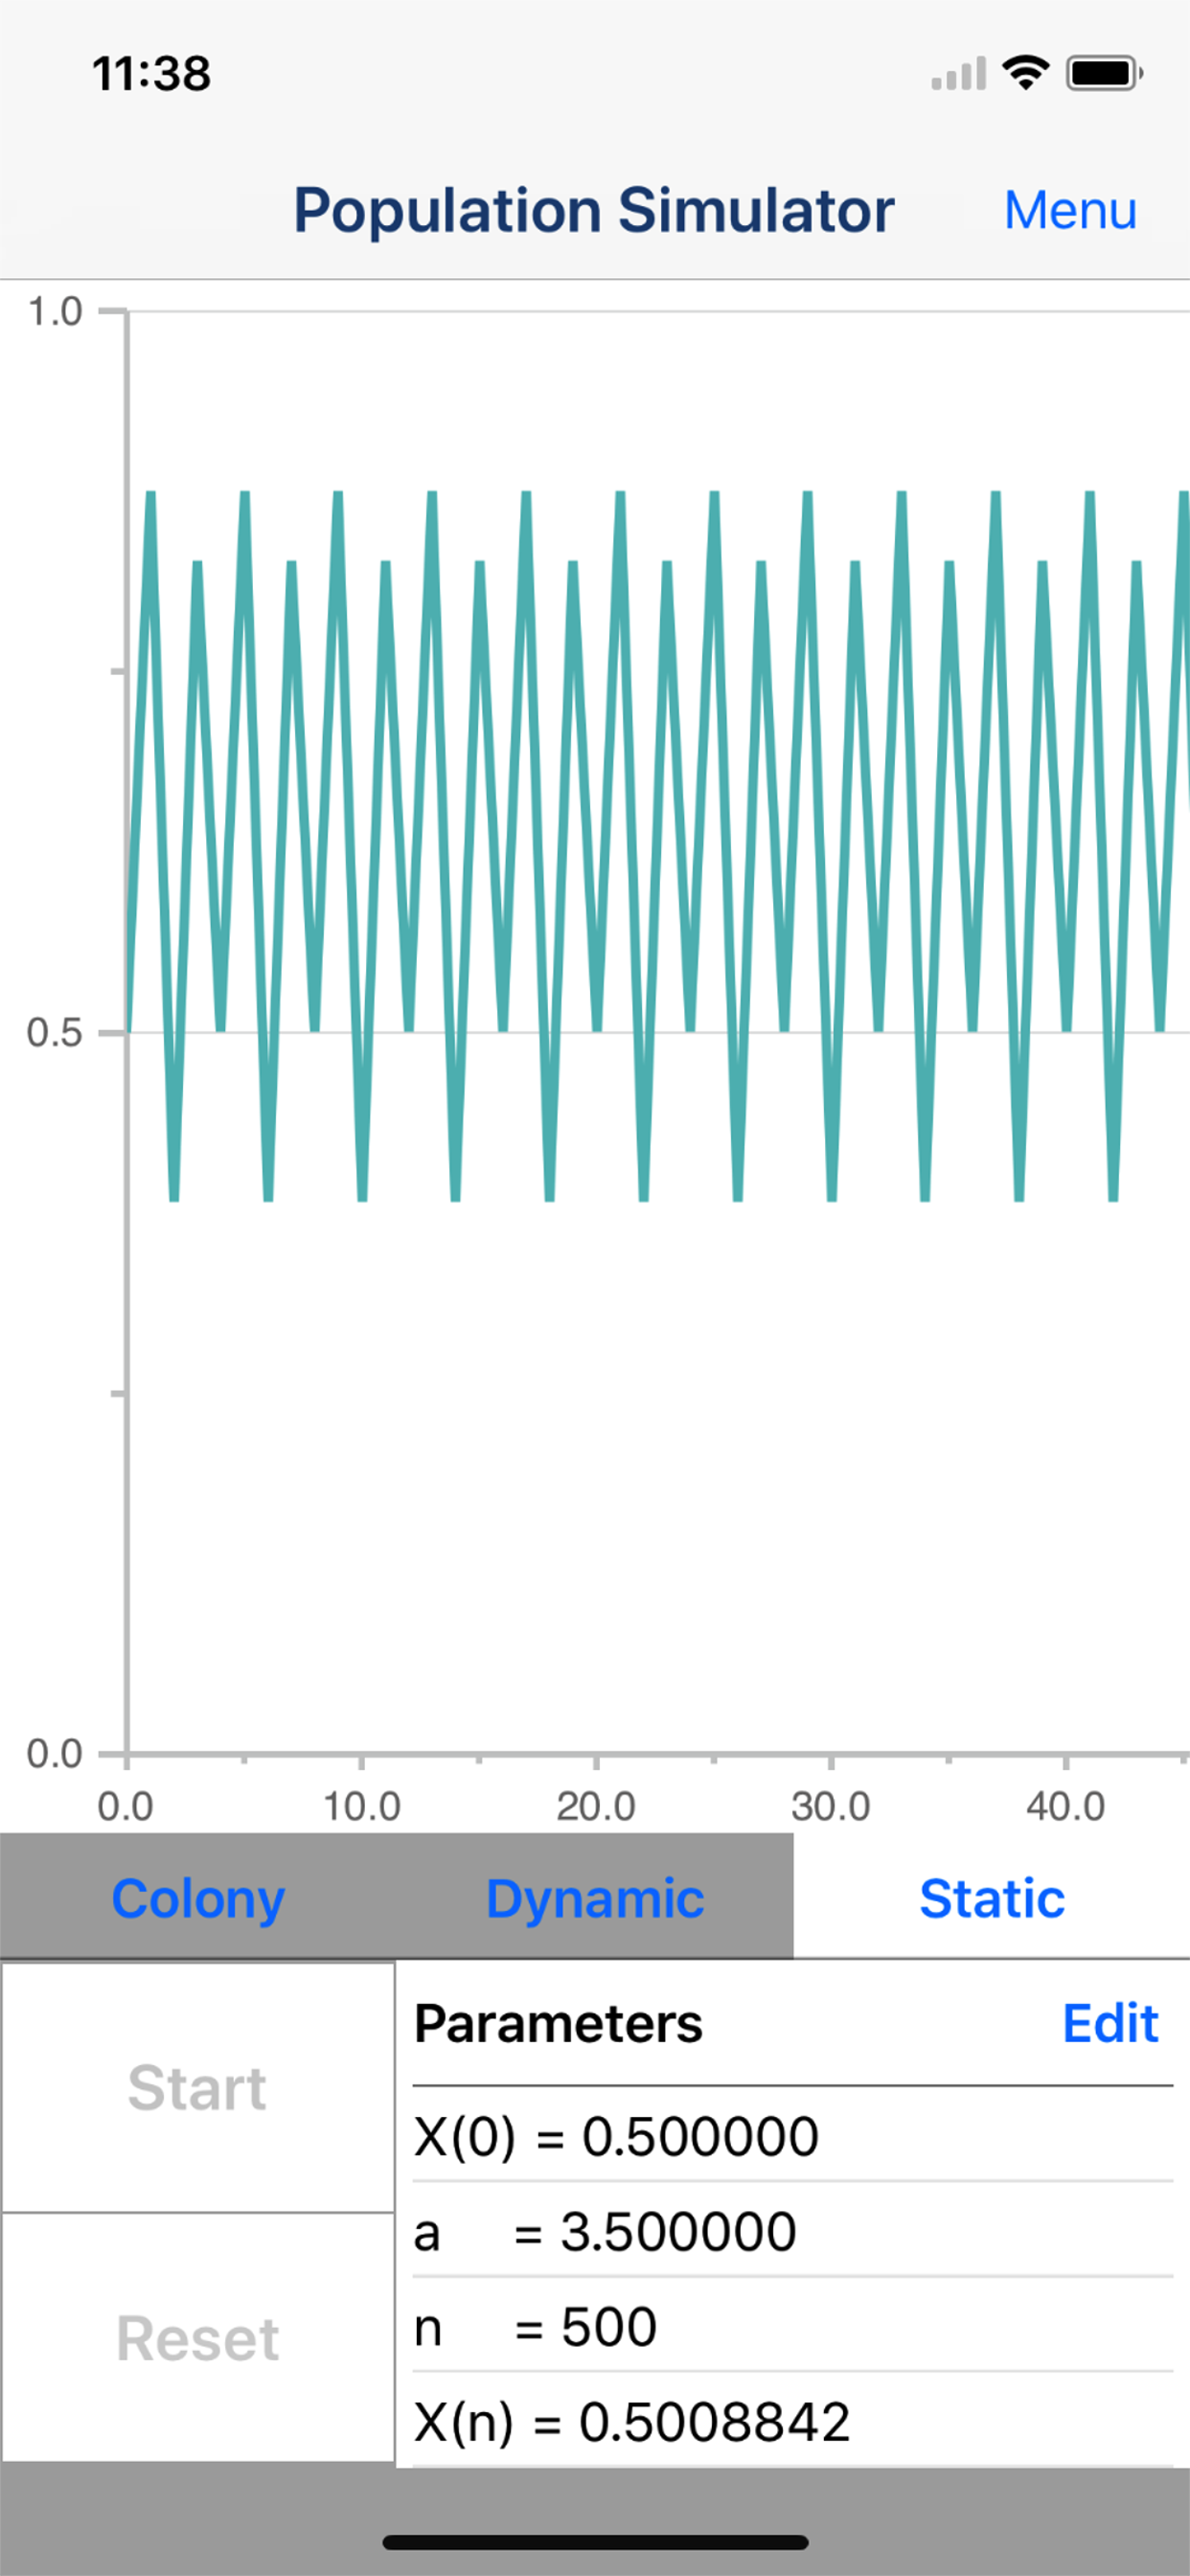
・In case (3<a≦3.5699456・・・) : X(n) oscillate between the periodic point individual Power of 2
・In case (3.5699456・・・<a≦4) : X(n) Change irregularly.(Chaotic region)*It may become periodically by the value of a.
Please try to observe the changes of Logistic Map by changing the various initial values.
■Main function of App
1. Simulation of changes in colony size
2. Line graph of changes in population
3. Output CSV file(Need to purchase add-on.)
4. Output Graph Image(Need to purchase add-on.)
In-App-Käufe
- Add Output Function
- 0,99 €
Screenshots


Simulador de población Häufige Fragen
-
Ist Simulador de población kostenlos?
Ja, Simulador de población ist kostenlos herunterzuladen, enthält jedoch In-App-Käufe oder Abonnements.
-
Ist Simulador de población seriös?
Nicht genügend Bewertungen, um eine zuverlässige Einschätzung vorzunehmen. Die App benötigt mehr Nutzerfeedback.
Danke für die Stimme -
Wie viel kostet Simulador de población?
Simulador de población bietet mehrere In-App-Käufe/Abonnements, der durchschnittliche In-App-Preis beträgt €0.99.
-
Wie hoch ist der Umsatz von Simulador de población?
Um geschätzte Einnahmen der Simulador de población-App und weitere AppStore-Einblicke zu erhalten, können Sie sich bei der AppTail Mobile Analytics Platform anmelden.

Simulador de población Bewertungen
Store-Rankings
Simulador de población Konkurrenten
| Name | Downloads (30d) | Monatlicher Umsatz | Rezensionen | Bewertungen | Letzte Veröffentlichung | |
|---|---|---|---|---|---|---|

Deplorables: Election Baskets
US Presidential Election 2016
|
Freischalten
|
Freischalten
|
0
|
|
vor 4 Jahren | |

Overpopulation
|
Freischalten
|
Freischalten
|
0
|
|
vor 3 Jahren | |

ONELAB
Finite Element Solver
|
Freischalten
|
Freischalten
|
0
|
|
vor 2 Jahren | |

NewtonianMechanicsLight
astroDynamicsSimulator
|
Freischalten
|
Freischalten
|
0
|
|
vor 1 Jahr | |

CO2 Modeller
|
Freischalten
|
Freischalten
|
0
|
|
vor 2 Jahren | |

Hyperbolic Games
|
Freischalten
|
Freischalten
|
0
|
|
vor 4 Jahren | |

探索分形世界
激发学习探索数学物理知识的兴趣
|
Freischalten
|
Freischalten
|
0
|
|
vor 3 Jahren | |

Mysteries of Fractal
Amazing Math & Fractal Arts
|
Freischalten
|
Freischalten
|
0
|
|
vor 9 Monaten | |

Recursivity
Beauty of Chaos and Fractals
|
Freischalten
|
Freischalten
|
0
|
|
vor 4 Jahren | |
PE.Mech
A tool for studying physics
|
Freischalten
|
Freischalten
|
0
|
|
vor 2 Jahren |
個体群シミュレーター Installationen
Letzte 30 Tage
個体群シミュレーター Umsatz
Letzte 30 TageSimulador de población Einnahmen und Downloads
Melden Sie sich jetzt an, um Zugriff auf Downloads, Einnahmen und mehr zu erhalten.
App-Informationen
- Kategorie
- Education
- Herausgeber
-
TAIKI HIRATA

- Sprachen
- English, Japanese
- Letzte Veröffentlichung
- 2.0 (vor 1 Jahr )
- Veröffentlicht am
- May 30, 2014 (vor 10 Jahren )
- Auch verfügbar in
- Japan, Brasilien, China, Mexiko, Philippinen, Peru, Neuseeland, Norwegen, Niederlande, Nigeria, Malaysia, Polen, Libanon, Kasachstan, Kuwait, Südkorea, Italien, Pakistan, Israel, Portugal, Rumänien, Russland, Saudi-Arabien, Singapur, Thailand, Türkei, Taiwan, Ukraine, Vereinigte Staaten, Vietnam, Südafrika, Dominikanische Republik, Argentinien, Österreich, Australien, Aserbaidschan, Belgien, Belarus, Kanada, Schweiz, Chile, Kolumbien, Tschechien, Deutschland, Dänemark, Indien, Algerien, Ecuador, Ägypten, Spanien, Finnland, Frankreich, Vereinigtes Königreich, Griechenland, Sonderverwaltungsregion Hongkong, Ungarn, Indonesien, Irland, Vereinigte Arabische Emirate
- Zuletzt aktualisiert
- vor 1 Woche
- © 2024 AppTail.
- Unterstützung
- Privacy
- Terms
- All Apps