Simple to use
I liked it because it’s very simple to use and feels light. Exporting report is also not a challenge given the graphs and all . Thanks .


Ja, Blood Glucose Tracker & Diary ist komplett kostenlos und enthält keine In-App-Käufe oder Abonnements.
🤔 Die Qualität der Blood Glucose Tracker & Diary-App ist gemischt. Einige Nutzer sind zufrieden, während andere Probleme melden. Ziehen Sie in Betracht, einzelne Bewertungen für mehr Kontext zu lesen.
Blood Glucose Tracker & Diary ist kostenlos.
Um geschätzte Einnahmen der Blood Glucose Tracker & Diary-App und weitere AppStore-Einblicke zu erhalten, können Sie sich bei der AppTail Mobile Analytics Platform anmelden.

4.56 von 5
45 Bewertungen in Indien
I liked it because it’s very simple to use and feels light. Exporting report is also not a challenge given the graphs and all . Thanks .
Its quite good app for sugar monitoring n adjusting medicine doses
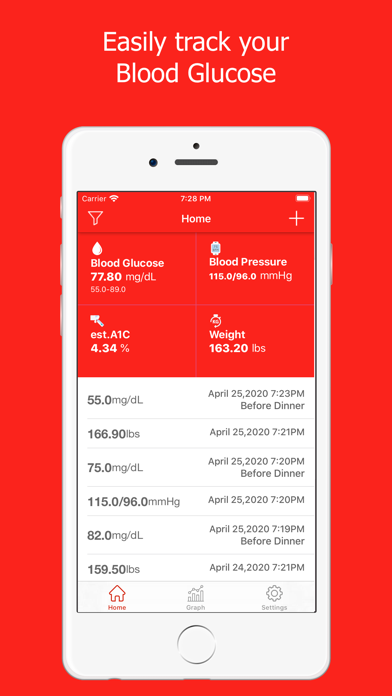
It is best Blood Glucose tracker app. Features like quick add glucose, blood pressure, weight and estimated a1c. I like export to csv and pdf feature.
Went to send an email from the app and it said was not deliverable as the domain no longer exists?? So is someone monitoring this app? Or is it useless? I had a question on the app there’s a white circle that goes down as you log, when it totally disappears what does that mean? Will you be charging for this app soon?
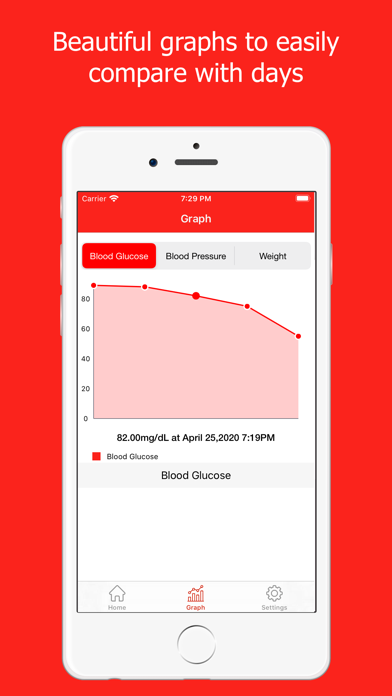
Great for looking back and checking changes
Requires association with Apple or Google account. No privacy despite claim to not collect data. Beware of this type of privacy invasion with any app.
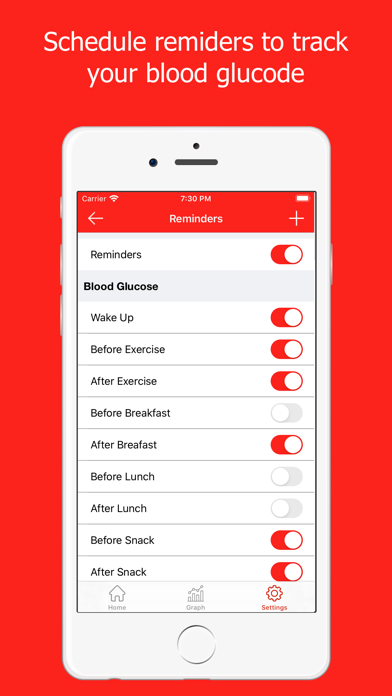
Reminders, different categories of instances.
I like this. It's quick and simple. I esp like that I can print off my results so I can give them to the doctor for my chart. Would love to have the results upload to my iHealth or LoseIt! app but other than that this is a very nice app.
I was just diagnosed as diegetic and this app has helped me track my sugar levels and made a stressful situation less stressful. Almost manageable.
It would be great to include an acceptable (adjustable by the user) range for measurements. Then graph readings in good range in green and out of range in red. Graphs should give information in a glance but without the difference the observer must analyze the data and it defeats the point of graphing.