
Dow Jones 30 Stocks Heat Map
Beschreibung
.Intraday Market Data update every minute when stock market opens
.High, Low, Open, Close, ROI (Gain), Volume, Average Volume, Price strength and volume momentum data.
."Strength" measures strength of the price movement of a stock compared to other stocks.
."Momentum" measures trading volume of a stock compared to its own average volume.
.The "Average Volume" and "Momentum" numbers are adjusted to the portion of the current trading period automatically. They are also normalized to the high volume movements at market open and before market close.
The "Average Volume" and "Momentum" numbers include trading volumes in after-market hours (4 - 8pm Eastern Time). The numbers at 4pm are not 100% of the daily trading volumes, but are at 84% to 89% of the daily volumes.
.Intraday price chart (new feature in version 3) for stocks.
.Colorful representation of gain and loss.
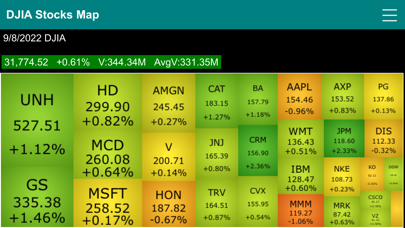
.Block size represents weight of each stock within the index.
.Dow Jones 30 Industry stocks compositions and allocations.
.Company fundamental data including market cap, earnings, dividend, price target, ... and much more.
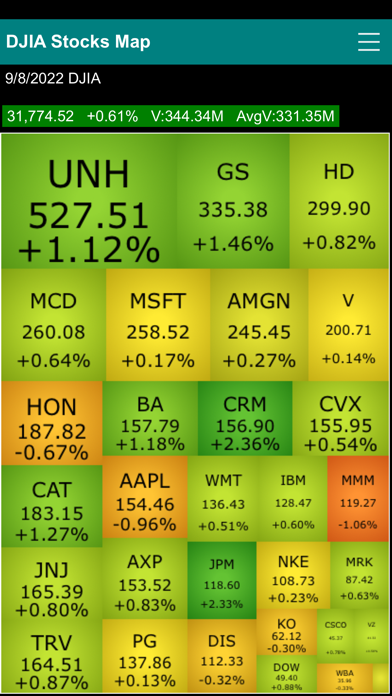
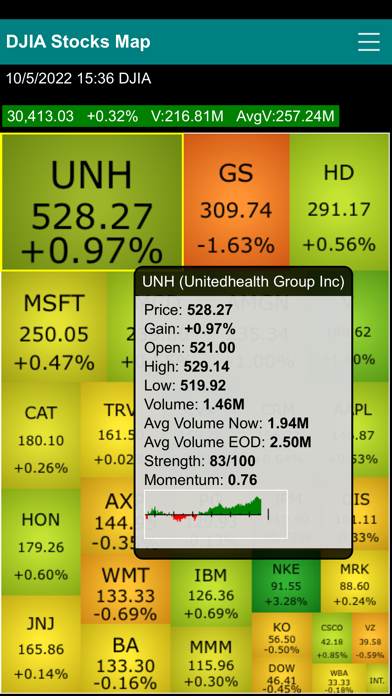
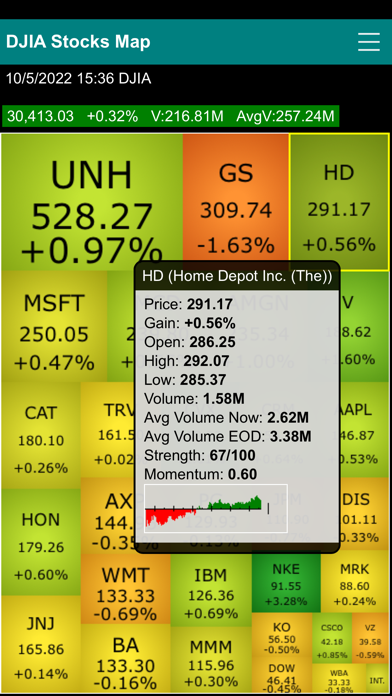
Stock market map (a.k.a. market heat map or market tree map) is a visual representation stock market data. It is an investment research tool let you quickly view the performance of different stocks. The size of the block in the map represents the values of the component within the portfolio. The color of the block represents ROI (price gain) of the component. The overall performance of the portfolio can be easily grasped by a glimpse to the map by the color and size of the blocks.
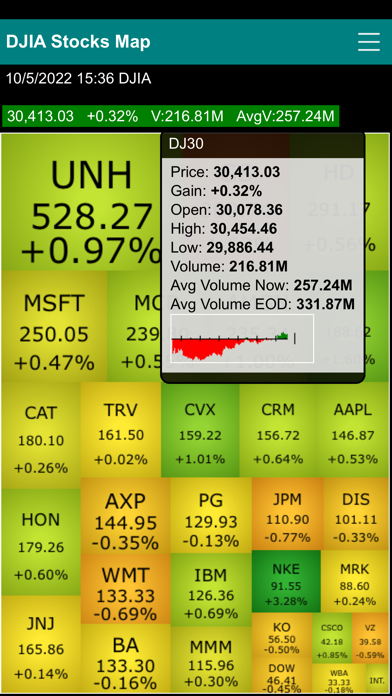
Tapping a block brings up a popup box showing the name, daily closing price, daily gain, daily volume and the 13 week average volume of the stock. The name of each component is labeled on top of each block. Market data are updated every minute.
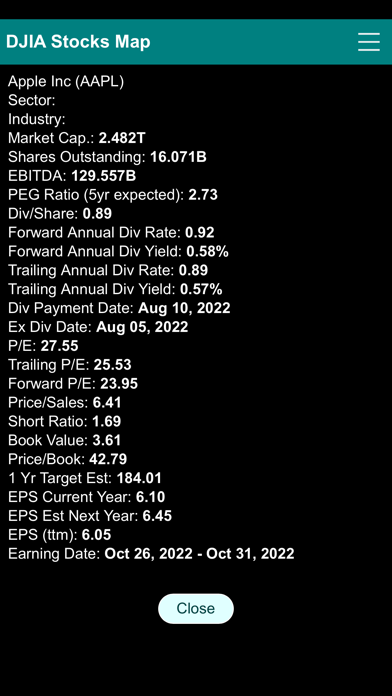
Double tap a stock shows company fundamental data when double tap on a stock map. The fundamental data include Market capitalization, outstanding shares, EBITDA, PEG Ratio, Dividend per share, forward and trailing dividend rate and yield, dividend payout date, ex div date, P/E, trailing and forward PE, price/sales, short ratio, book value, price/book, price target, current and forward EPS, EPS report date, EPS ttm, Basic EPA, Diluted EPS, High/Low EPS estimation, number of analysts.
In-App-Käufe
- App Registration
- ₱ 999.00
Screenshots

Dow Jones 30 Stocks Heat Map Häufige Fragen
-
Ist Dow Jones 30 Stocks Heat Map kostenlos?
Ja, Dow Jones 30 Stocks Heat Map ist kostenlos herunterzuladen, enthält jedoch In-App-Käufe oder Abonnements.
-
Ist Dow Jones 30 Stocks Heat Map seriös?
Nicht genügend Bewertungen, um eine zuverlässige Einschätzung vorzunehmen. Die App benötigt mehr Nutzerfeedback.
Danke für die Stimme -
Wie viel kostet Dow Jones 30 Stocks Heat Map?
Dow Jones 30 Stocks Heat Map bietet mehrere In-App-Käufe/Abonnements, der durchschnittliche In-App-Preis beträgt 999.00 ₱.
-
Wie hoch ist der Umsatz von Dow Jones 30 Stocks Heat Map?
Um geschätzte Einnahmen der Dow Jones 30 Stocks Heat Map-App und weitere AppStore-Einblicke zu erhalten, können Sie sich bei der AppTail Mobile Analytics Platform anmelden.

Dow Jones 30 Stocks Heat Map Bewertungen
Store-Rankings
Dow Jones 30 Stocks Heat Map Konkurrenten
| Name | Downloads (30d) | Monatlicher Umsatz | Rezensionen | Bewertungen | Letzte Veröffentlichung | |
|---|---|---|---|---|---|---|

Nasdaq100 Tech Heatwave
|
Freischalten
|
Freischalten
|
0
|
|
vor 2 Jahren | |

HeatMap: Visual Stock Map
Real-time Stock Market Heatmap
|
Freischalten
|
Freischalten
|
0
|
|
vor 2 Monaten | |

Stock Map: S&P 500 and More
Stock market at a glance
|
Freischalten
|
Freischalten
|
0
|
|
vor 1 Jahr | |

Indices Heatwave Indexes tool
Stock market Index analysis
|
Freischalten
|
Freischalten
|
0
|
|
vor 3 Jahren | |

Stocks Portfolio Manager
Stock market and portfolio
|
Freischalten
|
Freischalten
|
0
|
|
vor 11 Monaten | |

Global Stock Market
World Stock Indices
|
Freischalten
|
Freischalten
|
0
|
|
vor 4 Monaten | |

Data Trader
Trade with Data
|
Freischalten
|
Freischalten
|
0
|
|
vor 3 Jahren | |

S&P Stocks Ratings & Charts
Investing Powered by AI
|
Freischalten
|
Freischalten
|
0
|
|
vor 1 Monat | |

Stock Market Status
Market Watch
|
Freischalten
|
Freischalten
|
0
|
|
vor 2 Monaten | |

Stock Map: Stocks Market
stock market stocks investment
|
Freischalten
|
Freischalten
|
0
|
|
vor 2 Monaten |
Dow Jones 30 Stocks Heat Map Installationen
Letzte 30 Tage
Dow Jones 30 Stocks Heat Map Umsatz
Letzte 30 TageDow Jones 30 Stocks Heat Map Einnahmen und Downloads
Melden Sie sich jetzt an, um Zugriff auf Downloads, Einnahmen und mehr zu erhalten.
App-Informationen
- Kategorie
- Finance
- Herausgeber
- George Kung
- Sprachen
- English
- Letzte Veröffentlichung
- 3.5.0 (vor 2 Jahren )
- Veröffentlicht am
- Jul 2, 2021 (vor 3 Jahren )
- Auch verfügbar in
- Vereinigte Staaten, Südafrika, Philippinen, Italien, Peru, Neuseeland, Norwegen, Niederlande, Nigeria, Malaysia, Mexiko, Libanon, Kasachstan, Kuwait, Südkorea, Japan, Indien, Pakistan, Polen, Portugal, Rumänien, Russland, Saudi-Arabien, Schweden, Singapur, Slowenien, Thailand, Türkei, Taiwan, Ukraine, Vietnam, Dänemark, Argentinien, Österreich, Australien, Aserbaidschan, Belgien, Brasilien, Belarus, Kanada, Schweiz, Chile, China, Kolumbien, Tschechien, Deutschland, Vereinigte Arabische Emirate, Dominikanische Republik, Algerien, Ecuador, Ägypten, Spanien, Finnland, Frankreich, Vereinigtes Königreich, Griechenland, Sonderverwaltungsregion Hongkong, Ungarn, Indonesien, Irland, Israel
- Zuletzt aktualisiert
- vor 6 Tagen
- © 2024 AppTail.
- Unterstützung
- Privacy
- Terms
- All Apps