
Beschreibung
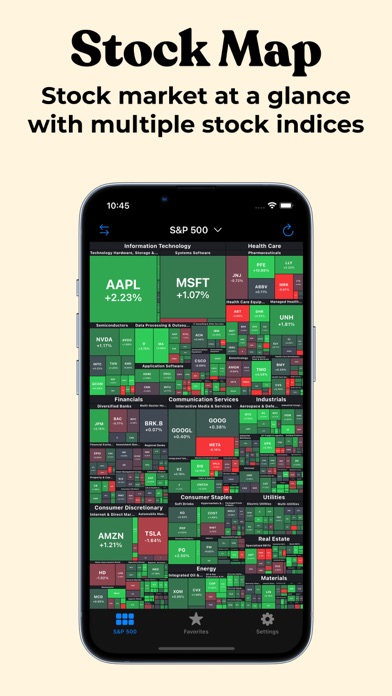
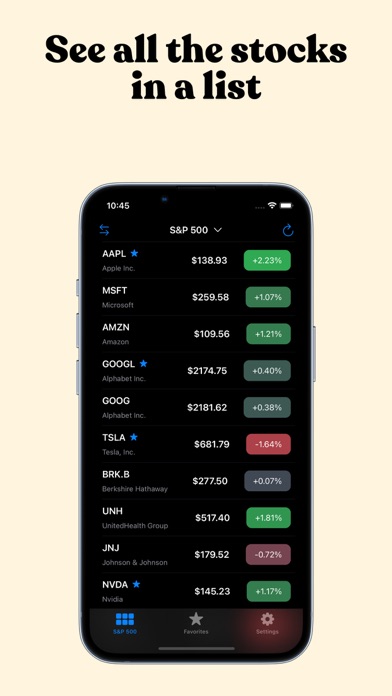
Stock Map visualizes all the S&P 500, Nasdaq 100, and Dow Jones stocks in a single view with a heat map/treemap and you can see the companies, sectors, and industries with a single look.
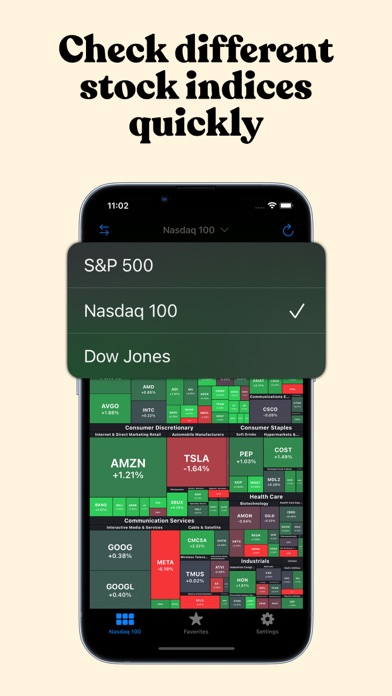
Main page displays S&P 500 stocks by default. But that view can be changed to display Nasdaq 100 or Dow Jones stocks by tapping on the title at the top.
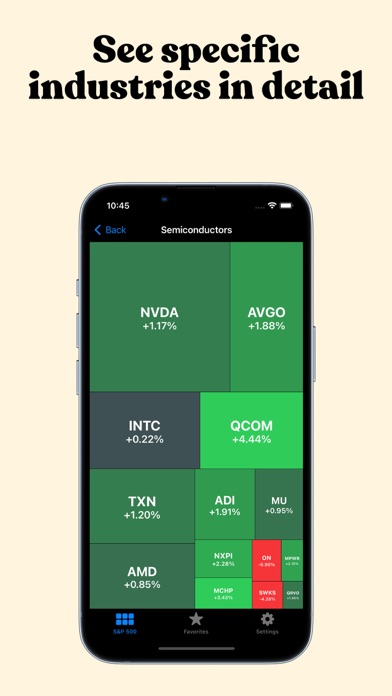
In the main view, tapping on a sector or an industry opens up a detailed view of that company. That way you can see the stocks that might be too small to see easily. When reached to the inner category, tapping on a stock opens the details of this stock in the iOS Stocks app (or in other apps/websites like Yahoo Finance when the user updates the settings).
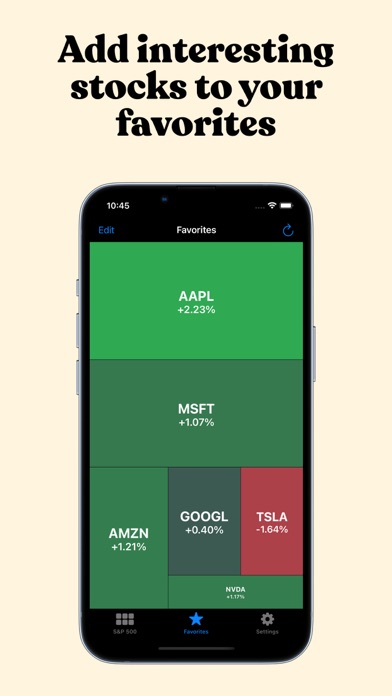
On the Favorites tab, you can add all of your favorite stocks to this view, and only they will appear in this list, so you can keep an eye on the stocks that you are interested in easily.
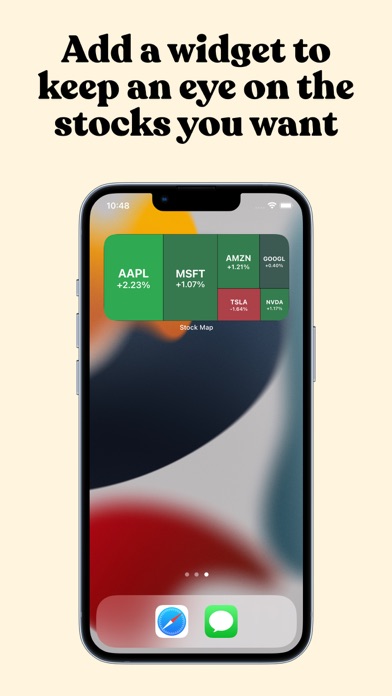
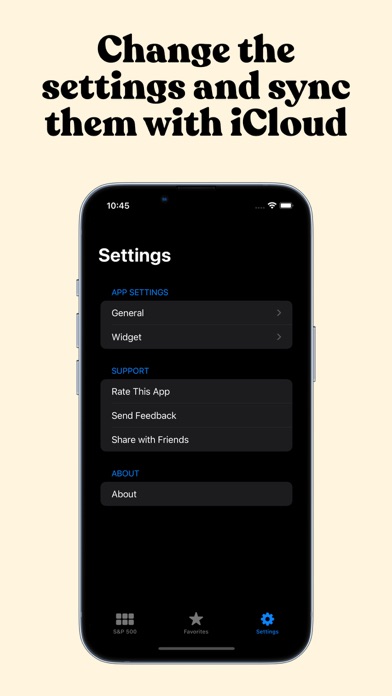
In addition to the main app, you can add widgets to your home page and keep an eye on the stocks. There are two main widget types, you can either add your favorites or you can add an industry category. To be able to do that, long press on the home page and press the "+" button on the top left corner. In the list that appears, search for Stock Map and add the widget type you would like to add. By default, the widget will be updated every 30 mins to not drain your battery quickly. But update frequency can be adjusted in the Widget settings page inside the app. It can be as low as 10 minutes or as high as 1 hour.
Stock Map visualizes the stock market with a market heat map (a.k.a. market treemap). The size of a block is determined by the market cap of that company. And the whole map is sorted by the market cap in descending order.
Privacy policy: https://stockmap.app/privacy-policy/
Terms and conditions: https://stockmap.app/terms-and-conditions/
Contact: https://stockmap.app/contact/
In-App-Käufe
- Annual Premium
- $27.49
- Monthly Premium
- $5.99
Screenshots
Stock Map Häufige Fragen
-
Ist Stock Map kostenlos?
Ja, Stock Map ist kostenlos herunterzuladen, enthält jedoch In-App-Käufe oder Abonnements.
-
Ist Stock Map seriös?
Nicht genügend Bewertungen, um eine zuverlässige Einschätzung vorzunehmen. Die App benötigt mehr Nutzerfeedback.
Danke für die Stimme -
Wie viel kostet Stock Map?
Stock Map bietet mehrere In-App-Käufe/Abonnements, der durchschnittliche In-App-Preis beträgt 16.74 $.
-
Wie hoch ist der Umsatz von Stock Map?
Um geschätzte Einnahmen der Stock Map-App und weitere AppStore-Einblicke zu erhalten, können Sie sich bei der AppTail Mobile Analytics Platform anmelden.

4.67 von 5
12 Bewertungen in Australien
Stock Map Bewertungen
Store-Rankings
|
Diagramm
|
Kategorie
|
Rang
|
|---|---|---|
|
Top Umsatz
|

|
41
|
|
Top Umsatz
|

|
74
|
|
Top Umsatz
|

|
80
|
|
Top Kostenlos
|

|
264
|
Schlüsselwörter
Stock Map Konkurrenten
| Name | Downloads (30d) | Monatlicher Umsatz | Rezensionen | Bewertungen | Letzte Veröffentlichung | |
|---|---|---|---|---|---|---|

Barchart Stocks & Futures
Quotes, Charts, and More
|
Freischalten
|
Freischalten
|
11
|
|
vor 11 Monaten | |

Stock Screener - AI Scanner
Trade Signal, Chart, Advisor
|
Freischalten
|
Freischalten
|
6
|
|
vor 4 Tagen | |

Stock Screener: Alert Scanner
Trade Signal, Market Trends
|
Freischalten
|
Freischalten
|
0
|
|
vor 1 Monat | |

OptionStrat: Options Toolkit
Calculator | Optimizer | Flow
|
Freischalten
|
Freischalten
|
1
|
|
vor 3 Wochen | |

StocksScreener signal
fidelity netbenefits
|
Freischalten
|
Freischalten
|
0
|
|
vor 1 Monat | |

Finview: Stock Screener
AI Stock Signal & Advisor
|
Freischalten
|
Freischalten
|
0
|
|
vor 1 Monat | |

Nasdaq Markets
|
Freischalten
|
Freischalten
|
0
|
|
vor 2 Monaten | |

HeatMap: Visual Stock Map
Real-time Stock Market Heatmap
|
Freischalten
|
Freischalten
|
0
|
|
vor 1 Monat | |

S&P 500 Stock Map
Stock Market Map S&P 500 Index
|
Freischalten
|
Freischalten
|
0
|
|
vor 1 Jahr | |

GuruFocus
Value Investing
|
Freischalten
|
Freischalten
|
2
|
|
vor 1 Woche |
Stock Map Installationen
Letzte 30 Tage
Stock Map Umsatz
Letzte 30 TageStock Map Einnahmen und Downloads
Melden Sie sich jetzt an, um Zugriff auf Downloads, Einnahmen und mehr zu erhalten.
App-Informationen
- Kategorie
- Finance
- Herausgeber
- Nazim Can Altinova
- Sprachen
- English
- Letzte Veröffentlichung
- 1.23 (vor 1 Jahr )
- Veröffentlicht am
- Dec 1, 2021 (vor 2 Jahren )
- Auch verfügbar in
- Vereinigte Staaten, Japan, Südkorea, Kanada, Deutschland, Mexiko, Thailand, Israel, Vereinigtes Königreich, Malaysia, Argentinien, Italien, Kolumbien, Taiwan, Dominikanische Republik, Sonderverwaltungsregion Hongkong, Brasilien, Australien, Spanien, Frankreich, Südafrika, Türkei, Peru, Chile, Ungarn, Saudi-Arabien, Russland, Ukraine, Portugal, Tschechien, Niederlande, Vereinigte Arabische Emirate, Belgien, Schweden, Rumänien, Kasachstan, Singapur, Schweiz, Österreich, Norwegen, Vietnam, Nigeria, Ecuador, Polen, China, Indonesien, Griechenland, Dänemark, Aserbaidschan, Indien, Ägypten, Finnland, Algerien, Irland, Pakistan, Philippinen, Neuseeland, Kuwait, Belarus, Libanon
- Zuletzt aktualisiert
- vor 1 Monat
- © 2024 AppTail.
- Unterstützung
- Privacy
- Terms
- All Apps