Does not work at all
Knowing the developer's other apps I am sure this one was pretty amazing, unfortunately it does not seem to work anymore: when opening the app, the following error message appears "web connection fail"...


Ja, Stock Position ist kostenlos herunterzuladen, enthält jedoch In-App-Käufe oder Abonnements.
Nicht genügend Bewertungen, um eine zuverlässige Einschätzung vorzunehmen. Die App benötigt mehr Nutzerfeedback.
Stock Position bietet mehrere In-App-Käufe/Abonnements, der durchschnittliche In-App-Preis beträgt 1.49 $.
Um geschätzte Einnahmen der Stock Position-App und weitere AppStore-Einblicke zu erhalten, können Sie sich bei der AppTail Mobile Analytics Platform anmelden.

Knowing the developer's other apps I am sure this one was pretty amazing, unfortunately it does not seem to work anymore: when opening the app, the following error message appears "web connection fail"...
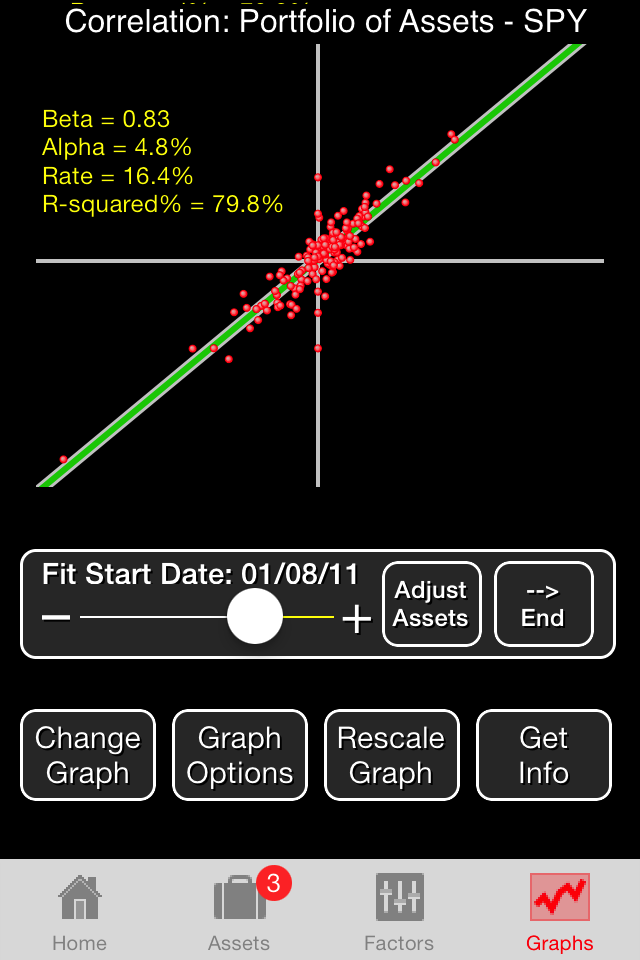
I use this app to compare the historic price of stocks and show how correlated they are (to each other and to indexes). It has great graphics.
| Name | Downloads (30d) | Monatlicher Umsatz | Rezensionen | Bewertungen | Letzte Veröffentlichung | |
|---|---|---|---|---|---|---|

Super Investor
Find next stock short squeeze
|
Freischalten
|
Freischalten
|
0
|
|
vor 7 Monaten | |

Paper Oyster
|
Freischalten
|
Freischalten
|
0
|
|
vor 2 Jahren | |

Lightstreamer Stock-List APNs
|
Freischalten
|
Freischalten
|
0
|
|
vor 9 Monaten | |

PortfolioPerspective
Keep your portfolio balanced!
|
Freischalten
|
Freischalten
|
0
|
|
vor 3 Jahren | |

OT Trend
|
Freischalten
|
Freischalten
|
0
|
|
vor 3 Jahren | |
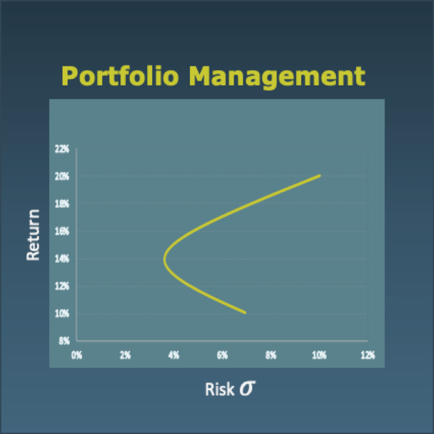
Portfolio Management
Set My Asset Allocation Out
|
Freischalten
|
Freischalten
|
0
|
|
vor 4 Monaten | |

BRRR Calculator
Position Sizing Calculator
|
Freischalten
|
Freischalten
|
0
|
|
vor 1 Jahr | |

MCarloRisk3D
Price/probability estimator
|
Freischalten
|
Freischalten
|
0
|
|
vor 2 Wochen | |

MCarloRisk3DLite
Drift/diffusion modeling
|
Freischalten
|
Freischalten
|
0
|
|
vor 6 Monaten | |

NeoFX Pro
|
Freischalten
|
Freischalten
|
0
|
|
vor 4 Tagen |
