Could be better
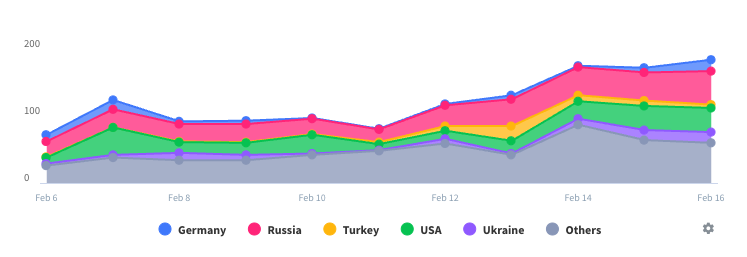
That app does what its supposed too but it frustrating it appears to be missing some basics extras. The graphs are all very nice but… why cant we switch these to numbers in a list showing energy in/out for the 30 mins slots rather than having to click on each graph peak. Ability to see daily, weekly, monthly, yearly as a number without having to add up all the graph peaks. Boost slider bar in 30 min intervals up to max, maybe add the boost option to the app landing screen rather than having to go into the menu? It would be even better if you gave the residential app the same information as the installer app, pump flow, flow / return temp ect like many HP and GB display.


