Beschreibung
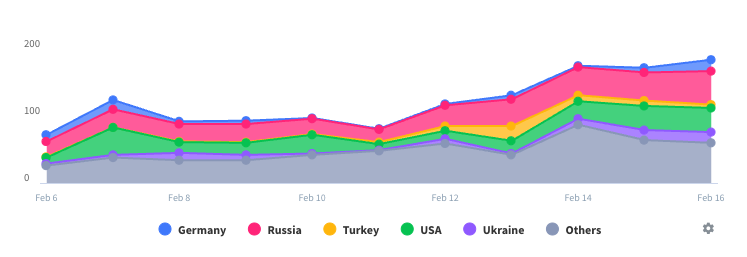
By selecting one of the different options in the overview, you can create easy and awesome looking charts.
You can now add the created chart as a widget to your homescreen.
Visualizer support all kind of charts:
- bar charts,
- pie charts,
- line charts
- bubble charts
all of them can be easily edited with the build in spreadsheet.
You can use a CSV file to add a data set.
All charts you create can be exported as JPG or PNG.
Infographer allows to create data visualizations.
This is a pure native app, so all app functionalities are performant and can be used offline.
In-App-Käufe
- Premium
- SAR 17.99
Screenshots
The Data Visualizer Häufige Fragen
-
Ist The Data Visualizer kostenlos?
Ja, The Data Visualizer ist kostenlos herunterzuladen, enthält jedoch In-App-Käufe oder Abonnements.
-
Ist The Data Visualizer seriös?
Nicht genügend Bewertungen, um eine zuverlässige Einschätzung vorzunehmen. Die App benötigt mehr Nutzerfeedback.
Danke für die Stimme -
Wie viel kostet The Data Visualizer?
The Data Visualizer bietet mehrere In-App-Käufe/Abonnements, der durchschnittliche In-App-Preis beträgt SAR 17.99.
-
Wie hoch ist der Umsatz von The Data Visualizer?
Um geschätzte Einnahmen der The Data Visualizer-App und weitere AppStore-Einblicke zu erhalten, können Sie sich bei der AppTail Mobile Analytics Platform anmelden.


The Data Visualizer Bewertungen
Store-Rankings


|
Diagramm
|
Kategorie
|
Rang
|
|---|---|---|
|
Top Kostenlos
|

|
244
|
The Data Visualizer Installationen
Letzte 30 TageThe Data Visualizer Umsatz
Letzte 30 TageThe Data Visualizer Einnahmen und Downloads
Melden Sie sich jetzt an, um Zugriff auf Downloads, Einnahmen und mehr zu erhalten.
App-Informationen
- Kategorie
- Graphics Design
- Herausgeber
- Michael Amling
- Sprachen
- German, French, English, Spanish
- Letzte Veröffentlichung
- 1.3 (vor 3 Wochen )
- Veröffentlicht am
- May 12, 2021 (vor 3 Jahren )
- Auch verfügbar in
- Vereinigte Staaten, Deutschland, Israel, Vereinigtes Königreich, Kanada, Malaysia, Philippinen, Peru, Neuseeland, Nepal, Norwegen, Niederlande, Nigeria, Portugal, Mexiko, Lettland, Sri Lanka, Libanon, Kasachstan, Kuwait, Slowenien, Südafrika, Vietnam, Ukraine, Taiwan, Türkei, Tunesien, Thailand, Slowakei, Pakistan, Singapur, Schweden, Saudi-Arabien, Russland, Rumänien, Italien, Polen, Algerien, Armenien, Argentinien, Österreich, Australien, Aserbaidschan, Belgien, Brasilien, Belarus, Schweiz, Chile, China, Kolumbien, Tschechien, Dänemark, Dominikanische Republik, Südkorea, Ecuador, Estland, Ägypten, Spanien, Finnland, Frankreich, Griechenland, Sonderverwaltungsregion Hongkong, Kroatien, Ungarn, Indonesien, Irland, Indien, Vereinigte Arabische Emirate, Japan
- Zuletzt aktualisiert
- vor 4 Tagen
- © 2025 AppTail.
- Unterstützung
- Privacy
- Terms
- All Apps


