
Описание
You can see the change in the population by the Logistic Map by a line graph and colony size.
You can observe the variation pattern of population variety by changing slightly the initial value.
Logistic Map is not only used in Population Ecology but also considered one of the starting point of Chaos Theory. I developed this app to help people who are studying Population Ecology or Chaos Theory.
*Logistic Map may not necessarily apply to changes in population of actual organisms, because Logistic Map is a model of a simple change of the population.
■What is Logistic Map?
The Logistic Map is the map that is generated from the Logistic Function that has been devised as a variation model of the population of an organism.
It is expressed by the following function.
X(n+1) = a・X(n)・(1-X(n))
In the above equation, the meaning of each symbol is as follows.
・n:Generation (n=1,2,3,...)
・X(n):Value obtained by normalizing the Population of Generation n-th(0≦X(n)≦1)
・a:Value obtained by normalizing the Reproductive Rates(0≦a≦4)
You can calculate the population of the next generation from a population of a certain generation by using this function. In addition, You can predict the variation of the population over the long term by calculating the population of individuals repeatedly in this function.
■Pattern of Logistic Map
Logistic map vary widely depending on the value of "a".
・In case (0≦a≦1) : X(n) converges to 0.
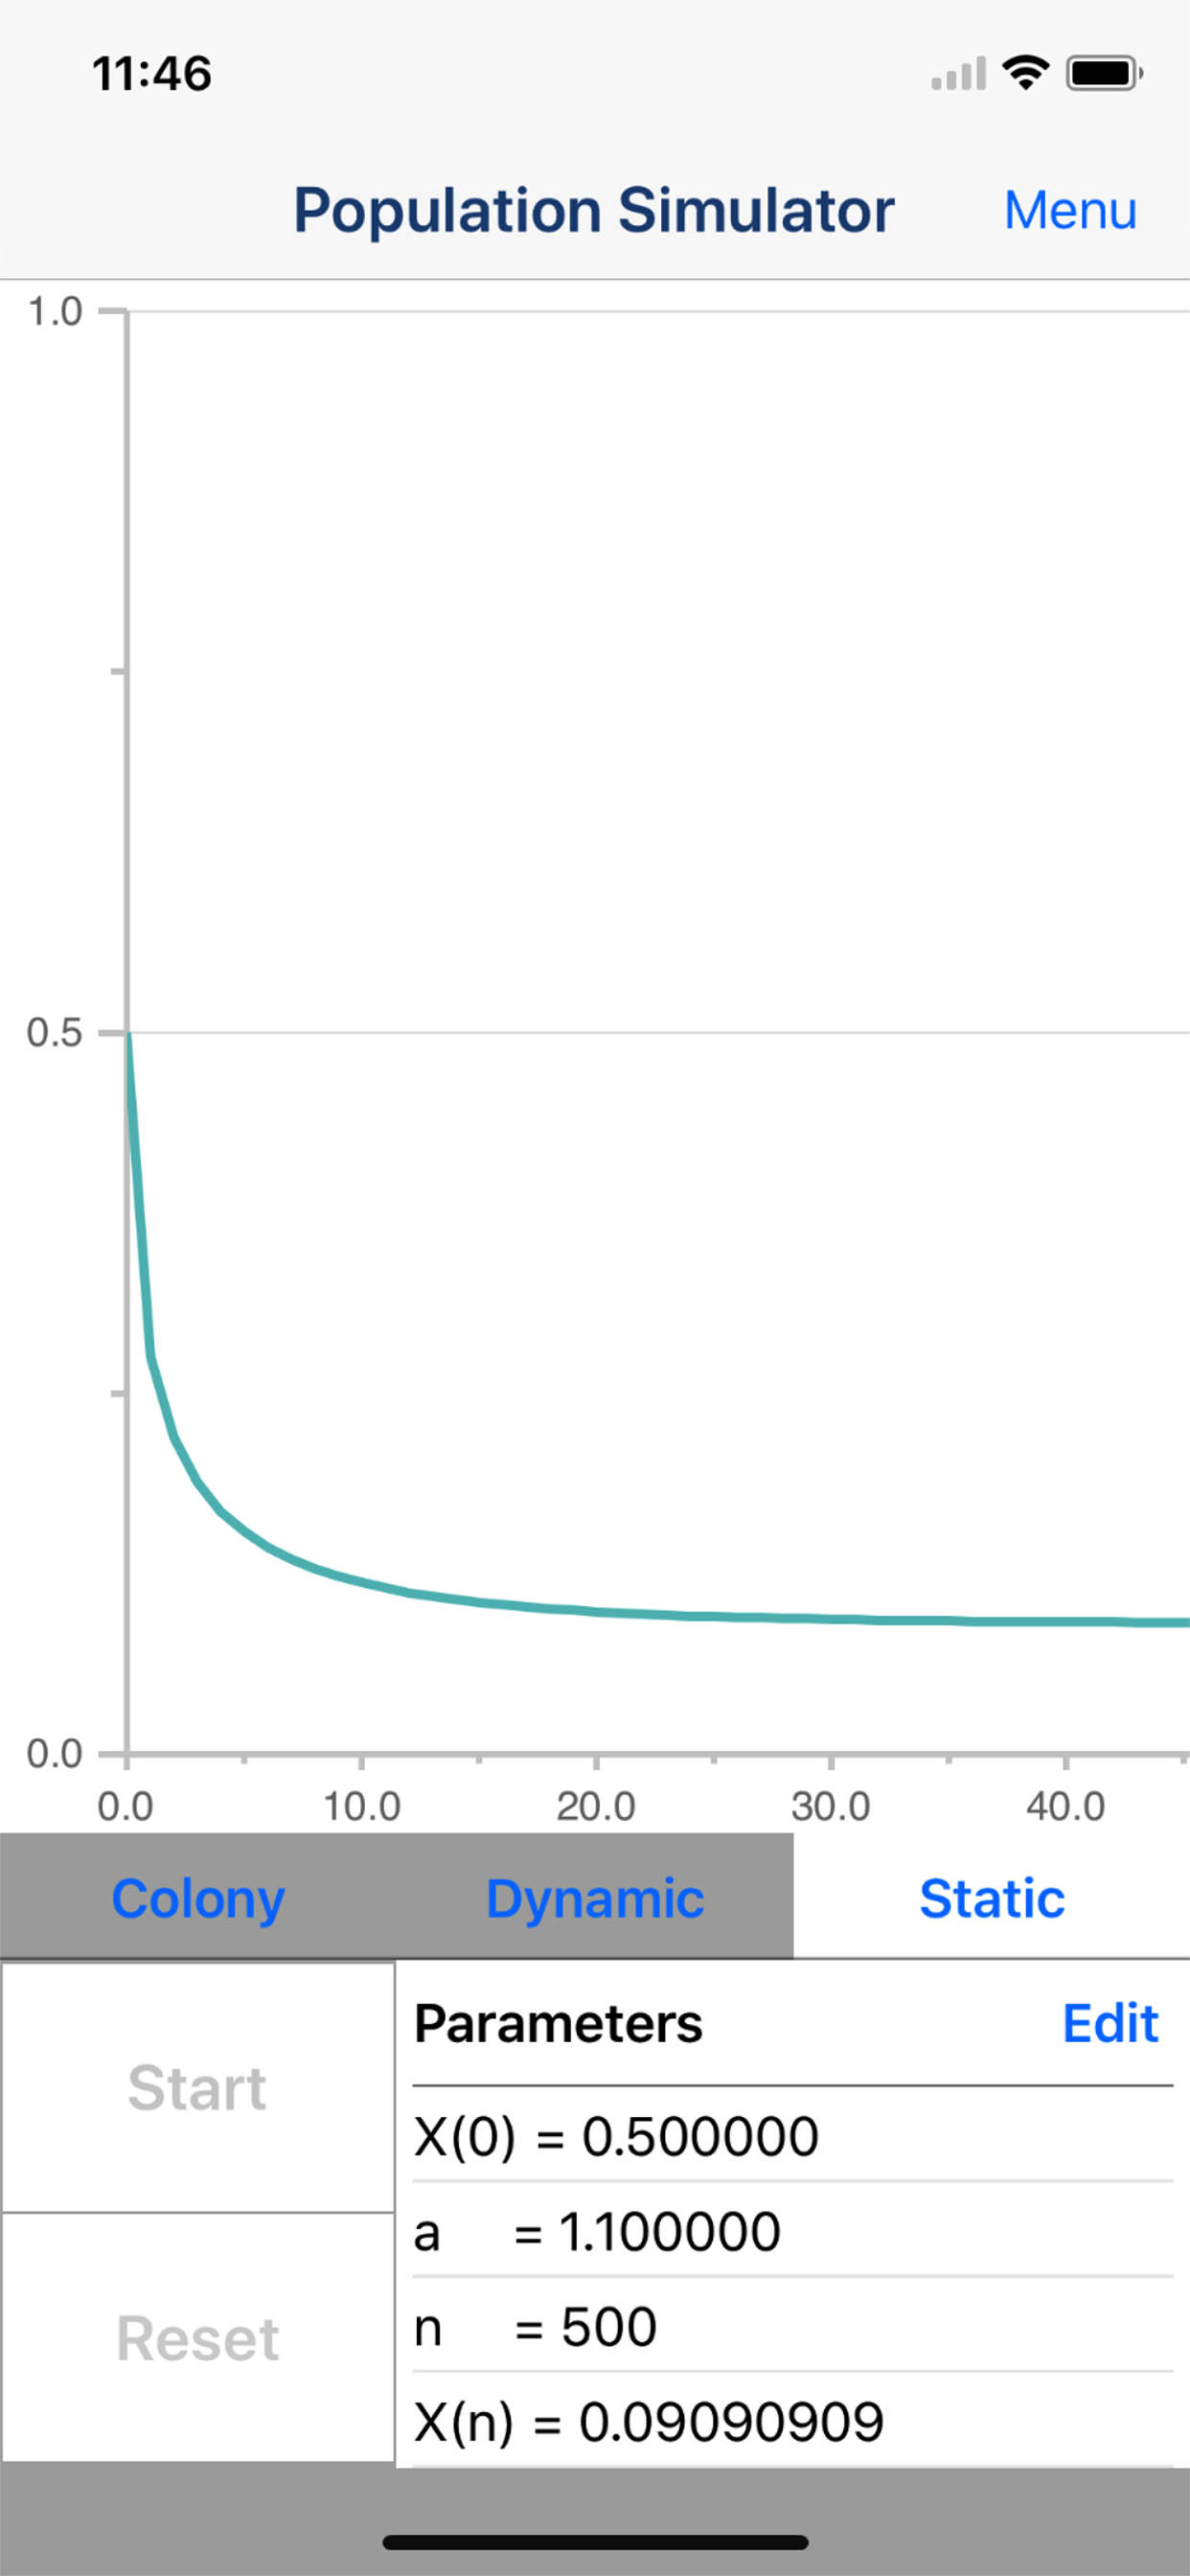
・In case (1<a≦2) : X(n) converges to 1-(1/a).
・In case (2<a≦3) : X(n) converges to 1-(1/a) while oscillating.
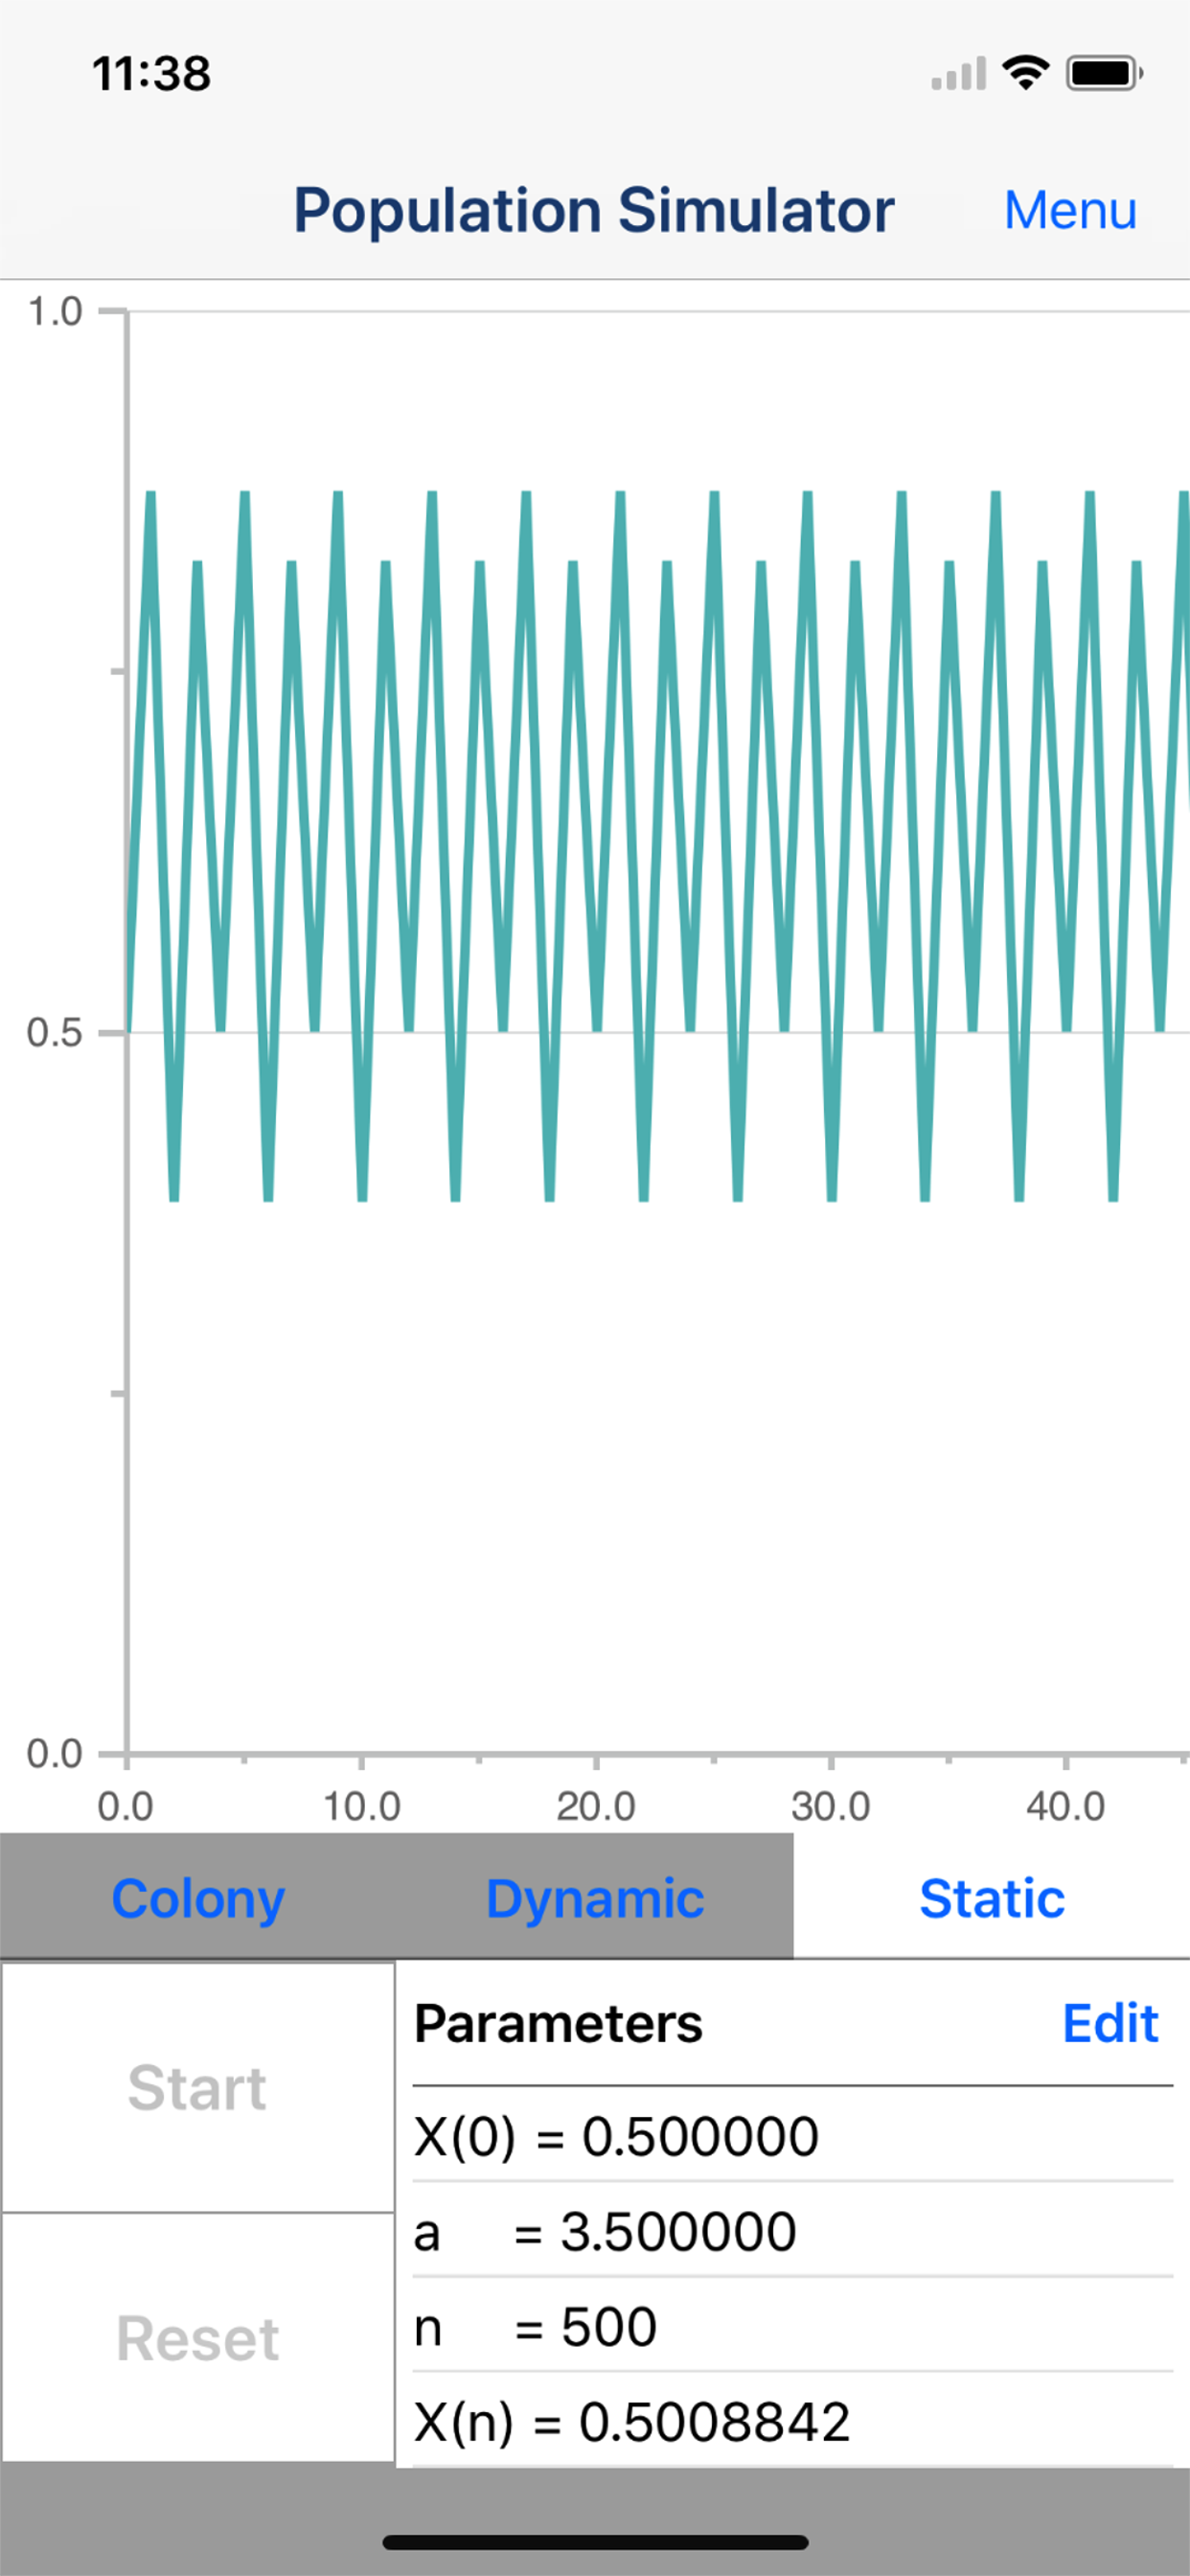
・In case (3<a≦3.5699456・・・) : X(n) oscillate between the periodic point individual Power of 2
・In case (3.5699456・・・<a≦4) : X(n) Change irregularly.(Chaotic region)*It may become periodically by the value of a.
Please try to observe the changes of Logistic Map by changing the various initial values.
■Main function of App
1. Simulation of changes in colony size
2. Line graph of changes in population
3. Output CSV file(Need to purchase add-on.)
4. Output Graph Image(Need to purchase add-on.)
Встроенные покупки
- Add Output Function
- $990
Скриншоты


Simulador de población Частые Вопросы
-
Приложение Simulador de población бесплатное?
Да, Simulador de población можно скачать бесплатно, однако в приложении есть встроенные покупки или подписки.
-
Является ли Simulador de población фейковым или мошенническим?
Недостаточно отзывов для надежной оценки. Приложению нужно больше отзывов пользователей.
Спасибо за ваш голос -
Сколько стоит Simulador de población?
Simulador de población имеет несколько покупок/подписок внутри приложения, средняя цена покупки составляет 990.00 $.
-
Сколько зарабатывает Simulador de población?
Чтобы получить оценку дохода приложения Simulador de población и другие данные AppStore, вы можете зарегистрироваться на платформе мобильной аналитики AppTail.

Simulador de población Отзывы Пользователей
Оценки
Simulador de población Конкуренты
| Name | Скачивания (30d) | Ежемесячный доход | Отзывы | Оценки | Последнее обновление | |
|---|---|---|---|---|---|---|

ProPilots Flugzeuge
Expert in Emergency Training
|
Открыть
|
Открыть
|
0
|
|
3 года назад | |
Group Theory and Games
|
Открыть
|
Открыть
|
0
|
|
4 года назад | |

Algoritmos (VPP)
Explicados y Animados
|
Открыть
|
Открыть
|
0
|
|
3 года назад | |

WW1 Daily Lite
|
Открыть
|
Открыть
|
0
|
|
2 года назад | |

Overpopulation
|
Открыть
|
Открыть
|
0
|
|
3 года назад | |

NewtonianMechanicsLight
astroDynamicsSimulator
|
Открыть
|
Открыть
|
0
|
|
1 год назад | |

NanoTubAR
|
Открыть
|
Открыть
|
0
|
|
3 года назад | |

Parametric Creature: Lab
A Glimpse of Complex Systems
|
Открыть
|
Открыть
|
1
|
|
2 года назад | |

Cross-contamination F English
|
Открыть
|
Открыть
|
0
|
|
3 года назад | |

Recursivity
Beauty of Chaos and Fractals
|
Открыть
|
Открыть
|
0
|
|
4 года назад |
個体群シミュレーター Установки
30дн.
個体群シミュレーター Доход
30дн.Simulador de población Доходы и Загрузки
Зарегистрируйтесь сейчас, чтобы получить доступ к статистика загрузок и доходов и многому другому.
Информация о приложении
- Категория
- Education
- Разработчик
-
TAIKI HIRATA

- Языки
- English, Japanese
- Последнее обновление
- 2.0 (1 год назад )
- Выпущено
- May 30, 2014 (10 лет назад )
- Также доступно в
- Япония, Бразилия, Китай, Мексика, Филиппины, Перу, Новая Зеландия, Норвегия, Нидерланды, Нигерия, Малайзия, Польша, Ливан, Казахстан, Кувейт, Республика Корея, Италия, Пакистан, Израиль, Португалия, Румыния, Россия, Саудовская Аравия, Сингапур, Таиланд, Турция, Тайвань, Украина, Соединенные Штаты, Вьетнам, Южно-Африканская Республика, Доминиканская Республика, Аргентина, Австрия, Австралия, Азербайджан, Бельгия, Беларусь, Канада, Швейцария, Чили, Колумбия, Чехия, Германия, Дания, Индия, Алжир, Эквадор, Египет, Испания, Финляндия, Франция, Великобритания, Греция, Гонконг (САР), Венгрия, Индонезия, Ирландия, ОАЭ
- Обновлено
- 1 неделю назад