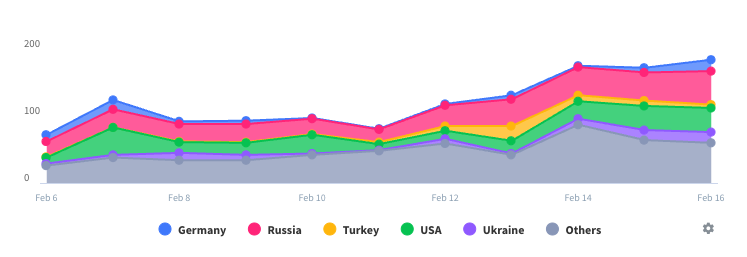
Graph shows only 1 week interval, Manually added bpm value can’t be an odd number
Even when I have collected several weeks of data, graph only shows 1 week interval. Buttons for 2w, 1month do not works. Graphs would be the most important tool to see BPM trends over weeks or months… Manually added bpm value can’t be an odd number, only even number. When I try to add a bpm of 15, it’s automatically changed for 14 in the records. I understand the background (x2 if measured for 30 sec), but seriously. If counted for 60 seconds, bpm CAN be 15. Everything else is great in this app but this feature is rather annoying.


