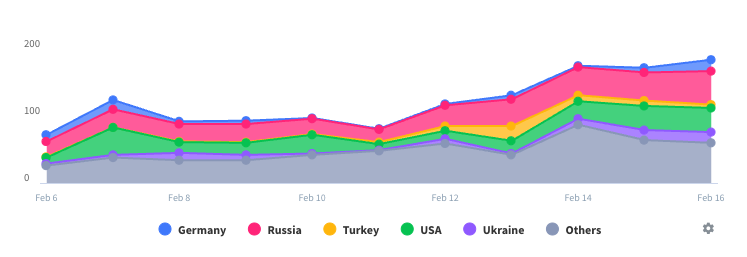
Chart looks horrible
It seems to only read the data at a resolution of one minute from HealthKit. The result is a graph that has about 60 points on each minute mark and a horrible curve trying to join them. Also if there is a large gap of a few hours it tries to fit the curve line between them which is pointless. Just leave them as disjointed charts. These seem easy to fix. It would also be nice if there was a display of the min and max of the displayed time period.


