
Описание
Visualizer allows you to create graphics in a new way.
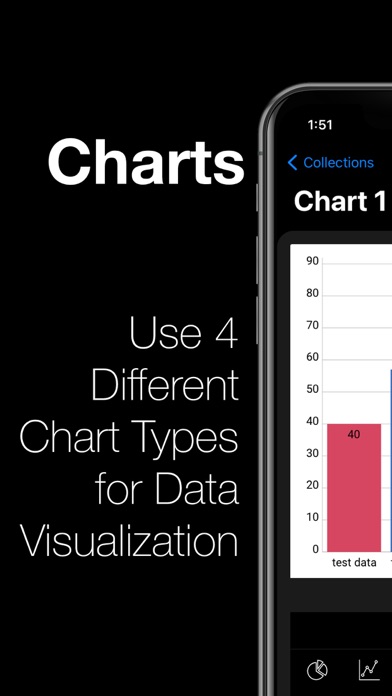
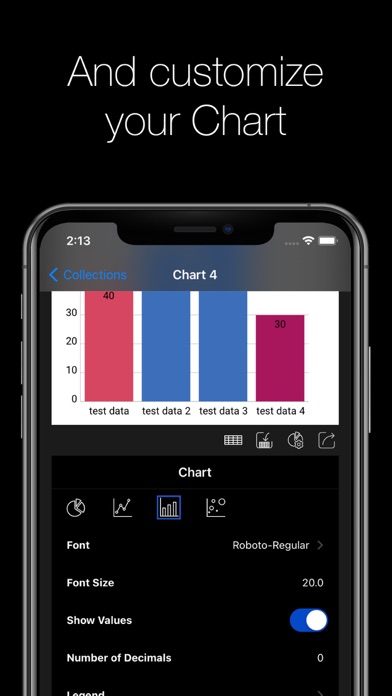
By selecting one of the different options in the overview, you can create easy and awesome looking charts.
You can now add the created chart as a widget to your homescreen.
Visualizer support all kind of charts:
- bar charts,
- pie charts,
- line charts
- bubble charts
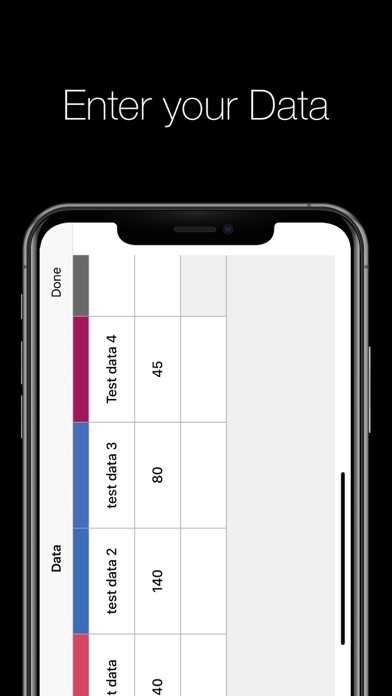
all of them can be easily edited with the build in spreadsheet.
You can use a CSV file to add a data set.
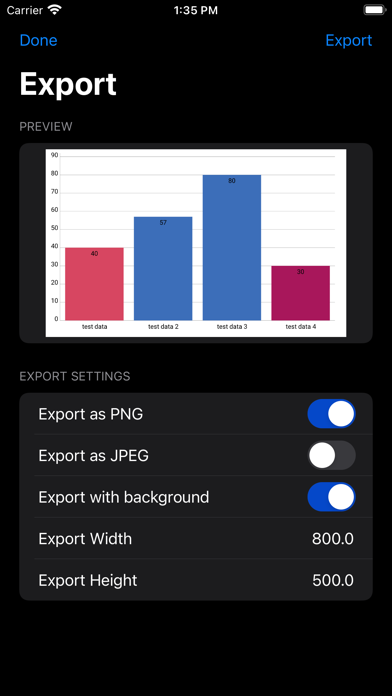
All charts you create can be exported as JPG or PNG.
Infographer allows to create data visualizations.
This is a pure native app, so all app functionalities are performant and can be used offline.
Скрыть
Показать больше...
By selecting one of the different options in the overview, you can create easy and awesome looking charts.
You can now add the created chart as a widget to your homescreen.
Visualizer support all kind of charts:
- bar charts,
- pie charts,
- line charts
- bubble charts
all of them can be easily edited with the build in spreadsheet.
You can use a CSV file to add a data set.
All charts you create can be exported as JPG or PNG.
Infographer allows to create data visualizations.
This is a pure native app, so all app functionalities are performant and can be used offline.
Скриншоты


DBT for Life Частые Вопросы
-
Приложение DBT for Life бесплатное?
Да, DBT for Life полностью бесплатное и не содержит встроенных покупок или подписок.
-
Является ли DBT for Life фейковым или мошенническим?
Недостаточно отзывов для надежной оценки. Приложению нужно больше отзывов пользователей.
Спасибо за ваш голос -
Сколько стоит DBT for Life?
Приложение DBT for Life бесплатное.
-
Сколько зарабатывает DBT for Life?
Чтобы получить оценку дохода приложения DBT for Life и другие данные AppStore, вы можете зарегистрироваться на платформе мобильной аналитики AppTail.

Оценки пользователей
Приложение еще не оценено в Португалия.
История оценок
DBT for Life Отзывы Пользователей
Нет отзывов в Португалия
Приложение пока не имеет отзывов в Португалия.
Оценки
История позиций в топах
История рейтингов пока не доступна
Позиции в категории
Приложение еще не было в топах
The Data Visualizer Установки
30дн.
The Data Visualizer Доход
30дн.DBT for Life Доходы и Загрузки
Получите ценные инсайты о производительности The Data Visualizer с помощью нашей аналитики.
Зарегистрируйтесь сейчас, чтобы получить доступ к статистика загрузок и доходов и многому другому.
Зарегистрируйтесь сейчас, чтобы получить доступ к статистика загрузок и доходов и многому другому.
Информация о приложении
- Категория
- Graphics Design
- Разработчик
- Michael Amling
- Языки
- English, French, German, Spanish
- Последнее обновление
- 1.3 (6 месяцев назад )
- Выпущено
- May 12, 2021 (4 года назад )
- Также доступно в
- Германия, Соединенные Штаты, Израиль, Великобритания, Канада, Словакия, Непал, Саудовская Аравия, Малайзия, Ирландия, Швеция, Нидерланды, Дания, Венгрия, Австрия, Беларусь, Колумбия, Гонконг (САР), Чили, Китай, Россия, ОАЭ, Вьетнам, Южно-Африканская Республика, Таиланд, Чехия, Индия, Пакистан, Италия, Сингапур, Тайвань, Новая Зеландия, Филиппины, Тунис, Швейцария, Хорватия, Алжир, Мексика, Румыния, Кувейт, Словения, Польша, Португалия, Норвегия, Нигерия, Перу, Люксембург, Бразилия, Бельгия, Доминиканская Республика, Финляндия, Азербайджан, Египет, Испания, Австралия, Армения, Греция, Франция, Шри-Ланка, Ливан, Турция, Украина, Республика Корея, Япония, Казахстан, Исландия, Латвия, Эстония, Аргентина, Индонезия, Эквадор
- Обновлено
- 4 месяца назад
This page includes copyrighted content from third parties, shared solely for commentary and research in accordance with fair use under applicable copyright laws. All trademarks, including product, service, and company names or logos, remain the property of their respective owners. Their use here falls under nominative fair use as outlined by trademark laws and does not suggest any affiliation with or endorsement by the trademark holders.
AppTail.