Need improvements
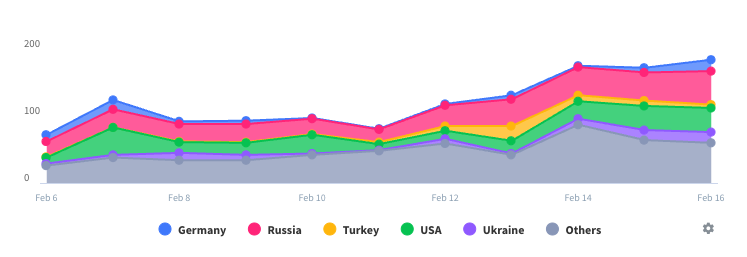
Please improve data graphs so it could show the exact time of the day, while scrolling through the data. It is mostly unusable now. Please add small description of each data, which wave plus can collect? including the normal thresholds. For example describe the CO2 and show that <600 is very good, 600-800 is ok, >800 bad, etc.


