Works well
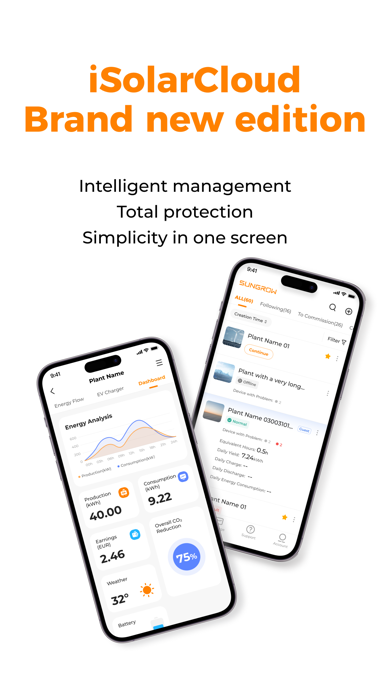
I find the app seems to strike a balance between, what’s happening right now and drilling into various charts and details for longer time periods.

Yes, iSolarCloud is completely free and it doesn't have any in-app purchases or subscriptions.
⚠️ The iSolarCloud app has poor ratings and negative feedback. Users seem unsatisfied with its performance or features.
iSolarCloud is free.
To get estimated revenue of iSolarCloud app and other AppStore insights you can sign up to AppTail Mobile Analytics Platform.

2.08 out of 5
392 ratings in Australia
I find the app seems to strike a balance between, what’s happening right now and drilling into various charts and details for longer time periods.
It’s so bad I’m attempting to delete my account. Of course it’s not that simple, your “plant” must be deleted first but there is no option to do this. It’s a horrendous app
Have had my new sungrow system in for a few months. This app is very good for performance monitoring and more detailed analysis. It has a clean summary page and heaps of data to dive into. Very impressive! (iSolarCloud web portal also works well). But suggestions to developers: - recent problem started: dashboard is not rolling over each morning in our GMT+10 time zone (have to close and reopen app every day) - numbers are way too small on the overview page on my iPhone (eg battery % is about 2mm high but there is still heaps of empty white space on the page to allow much larger fonts) - add ability to control basic battery functions to the app (ridiculous that I have to contact the installer to make ANY changes to battery parameters or actions) - reverse the recent layout change and put the “Energy Analysis” graph back to the top of the “Dashboard” page
As others have said, the revenue field is nonsense. It’s summing the cost avoided to the feed in tariff. It should be solely the feed in tariff. Would be great except for this silly oversight.
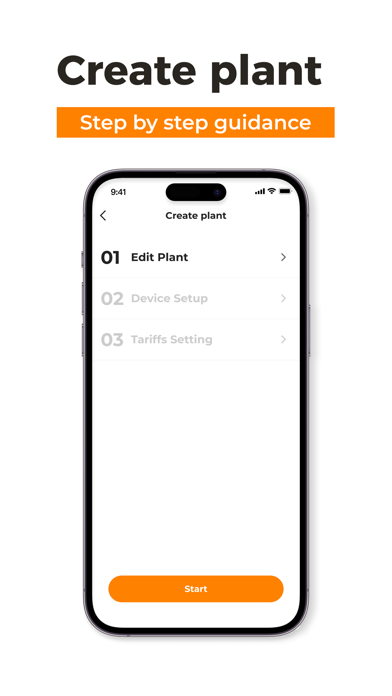
The tariff section in ISolarCloud needs an upgrade. Currently there is no way to add an updated tarrif (lets face it time of use tarrifs do change) with out deleting the old one. This means you lose all your old data to add the new tarrif or tarrifs. Should be a simple fix.
You need to build into the app the ability to control the battery, similar to net zero for Powerwall. I want to be able to control if I dispatch my battery into the grid, charge my battery or run off my battery.
It gives a good indication of where your power is going, but is a bit hit and miss as to if it will connect to your inverter. More options to personalise your power bill to the app would be nice.
Since this app received a major update a few months ago, it has become worse. The data and graphs are much less I formative than they used to be. For example, I could previously see the split between pv and purchased energy on a nice doughnut chart-but this functionality has gone now. Please bring back the old graphs and information!
Hi. I would really LOVE to see a widget PLEASE!! I would also really enjoy an update to support matter so we can integrate it with our smart homes. Please!!!??
Roses are red. Water is wet. The people making solar apps are almost universally incapable of making a good product. These are all equally true statements.
|
Chart
|
Category
|
Rank
|
|---|---|---|
|
Top Free
|
|
52
|
|
Top Free
|

|
117
|
|
Top Free
|

|
136
|
|
Top Free
|

|
241
|
|
Top Free
|

|
260
|
| Name | Downloads (30d) | Monthly Revenue | Reviews | Ratings | Recent release | |
|---|---|---|---|---|---|---|

Electrical Calculations
|
Unlock
|
Unlock
|
3
|
|
1 month ago | |

Swann Security
Security You Can Trust
|
Unlock
|
Unlock
|
271
|
476
|
3 days ago | |

FRITZ!App Smart Home
|
Unlock
|
Unlock
|
0
|
|
4 months ago | |

Fronius Solar.start
Fronius Device Commissioning
|
Unlock
|
Unlock
|
13
|
|
4 days ago | |

UniFi
Enterprise Network Management
|
Unlock
|
Unlock
|
30
|
1
|
1 week ago | |

Milwaukee® ONE-KEY™ ANZ
|
Unlock
|
Unlock
|
103
|
5
|
3 days ago | |

MeasureOn
Upgrade your efficiency
|
Unlock
|
Unlock
|
18
|
|
1 day ago | |

MyFRITZ!App
|
Unlock
|
Unlock
|
12
|
|
1 month ago | |

FRITZ!App Fon
|
Unlock
|
Unlock
|
14
|
|
1 month ago | |

Energy Viewer
|
Unlock
|
Unlock
|
14
|
|
2 years ago |
